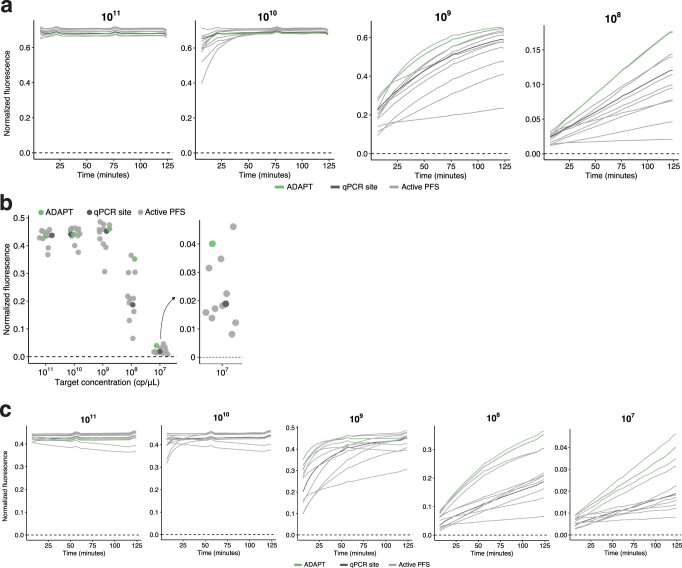
Extended Data Fig. 9. Benchmarking ADAPT’s designs in US CDC SARS-CoV-2 amplicons.
a, Fluorescence over time for Cas13 guides at varying target concentrations (top of each plot, in cp/μL) within the US CDC’s SARS-CoV-2 N1 RT-qPCR amplicon. Compared guides are ADAPT’s design (green), a guide with an active (non-G) PFS at the site of the qPCR probe from the N1 assay (dark gray), and 10 randomly selected guides with an active PFS (light gray). Target concentration of 107 cp/μL is shown in Fig. 5b. b, Fluorescence for Cas13 guides at varying target concentrations within the US CDC’s SARS-CoV-2 N2 RT-qPCR amplicon. The final time point is shown (124 minutes). Guides are as in a. c, Fluorescence over time for Cas13 guides at varying target concentrations (top of each plot, in cp/μL) within the US CDC’s SARS-CoV-2 N2 RT-qPCR amplicon. Guides are as in a.

