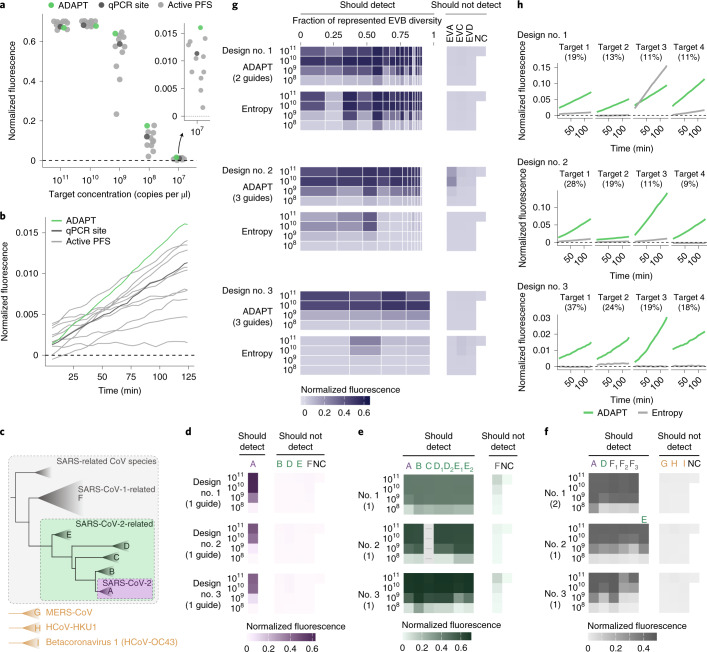
Fig. 5. Sensitive and specific detection with ADAPT’s designs.
a, Fluorescence at varying target concentrations in the US CDC’s SARS-CoV-2 N1 RT–qPCR amplicon. Compared Cas13 guides are: ADAPT’s guide (green); a guide with an active (non-G) PFS at the site of the N1 qPCR probe (dark gray); and ten randomly selected guides with an active PFS (light gray). All are constrained to the amplicon. b, Fluorescence over time for guides in a at target concentration of 107 copies per µl. Panel a shows the final time point. c, Phylogeny within the SARS-related CoV species based on ref. 47, and three other betacoronaviruses. d, Fluorescence for ADAPT’s top-ranked SARS-CoV-2 designs in detecting representative targets of the clades in c. Rankings, from 1 to 3, follow ADAPT’s predicted performance. The label to the left of each row indicates target concentration (copies per µl). NC, no template control. Colors refer to c. Parentheticals indicate the number of Cas13 guides in ADAPT’s design. e, Same as d, but for SARS-CoV-2-related. The empty column indicates the sequence in the amplicon has high ambiguity and was not tested. Clades D and E sometimes have two representative targets in an amplicon; when two target labels have one representative sequence, the same value is plotted under each label. f, Same as d, but for SARS-related CoV. F1 is SARS-CoV-1, and F2 and F3 are related bat SARS-like CoVs. E requires a separate representative target in only one amplicon. G, H and I are defined in c. g, Fluorescence for ADAPT’s top-ranked EVB designs in detecting EVB and representative targets for Enterovirus A/C/D (EVA/C/D). Each band is an EVB target having width proportional to the fraction of EVB genomic diversity represented, within the amplicon of ADAPT’s design. Under each ADAPT design is one baseline guide (‘Entropy’) from the site in the amplicon with an active PFS and minimal Shannon entropy. h, Fluorescence over time at target concentration of 108 copies per µl, for the four EVB targets encompassing the largest fraction of genomic diversity. Panel g shows the middle time point. In all panels, fluorescence is reference normalized and background subtracted (Methods).

