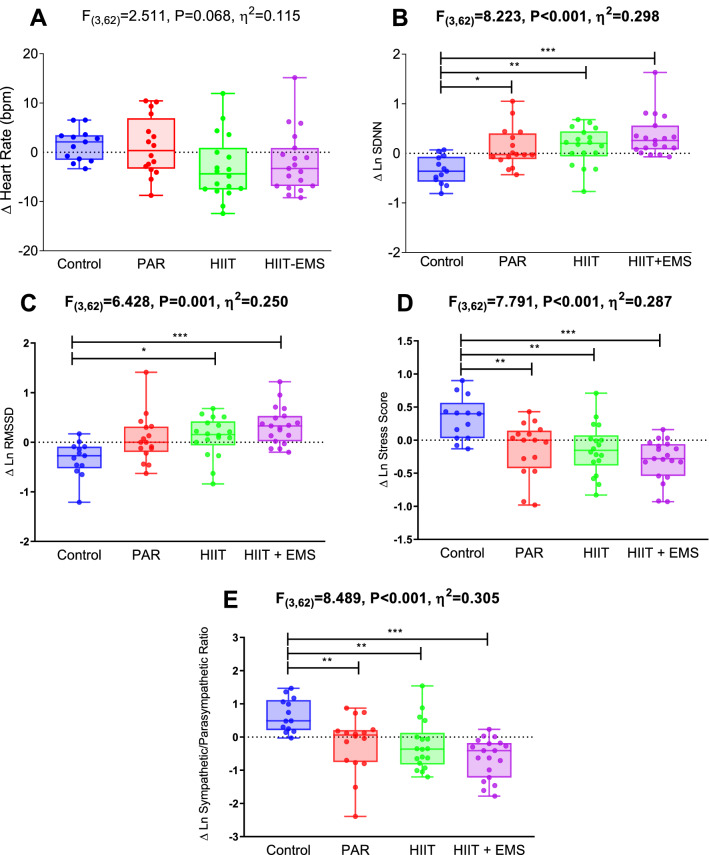
Fig. 2.
Changes in heart rate and heart rate variability parameters after the intervention study in the four groups. Analysis of covariance adjusting for baseline values, with post hoc Bonferroni-corrected t test. F, p and η2 of analysis of variance, *p < 0.05, **p < 0.01, ***p < 0.001. Abbreviations: ∆ Differences between post and pretest, bpm beats per minute, HIIT high-intensity interval training group; HIIT + EMS HIIT plus whole-body electromyostimulation group, Ln Napierian logarithm, PAR physical activity recommendation from the World Health Organization group, RMSSD square root of the mean squared differences between successive RR intervals, SDNN standard deviation of RR intervals

