Fig. 4.

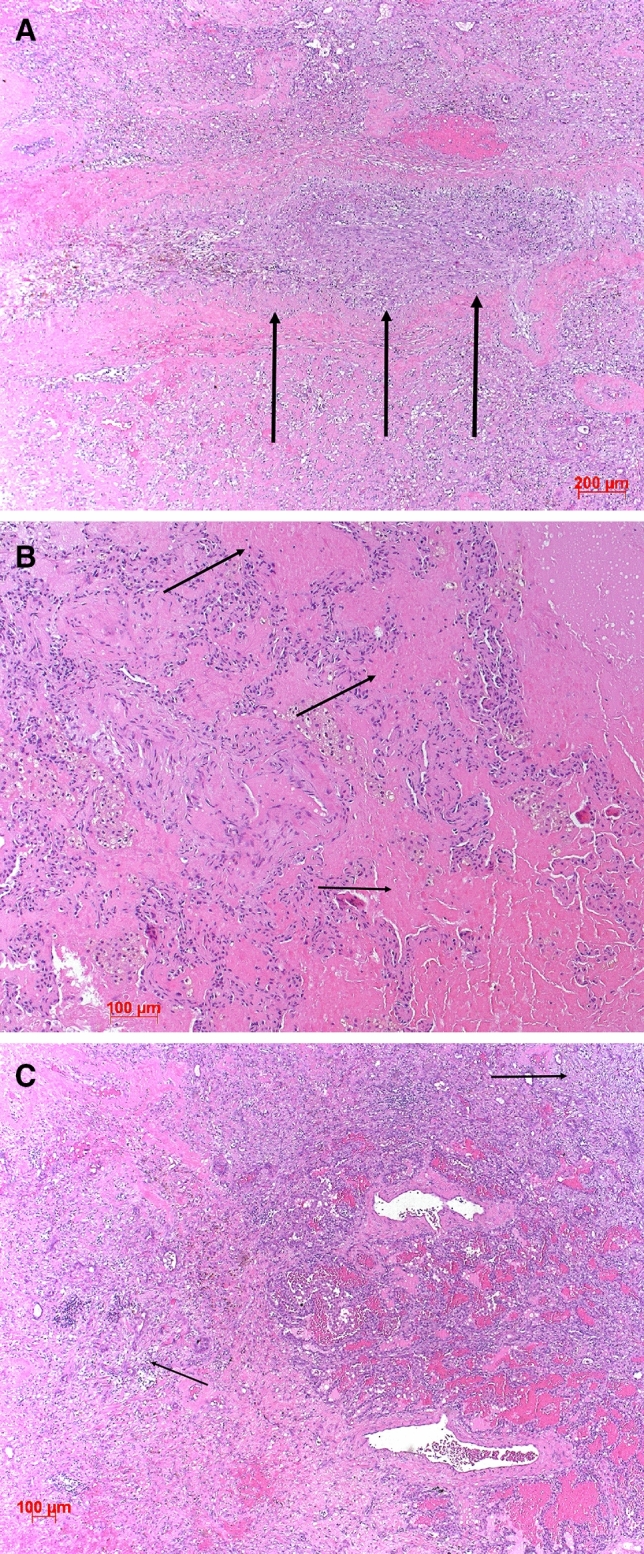
SLE illustrated; A shows arterial thrombosis in an organization (arrows), eosinophilic deposits (arrows) mimicking amyloid and unspecific fibrosis is seen in (B), and fibrosis focally OP (arrows) with hemorrhage in C). H&E, bars 200, 100 µm

SLE illustrated; A shows arterial thrombosis in an organization (arrows), eosinophilic deposits (arrows) mimicking amyloid and unspecific fibrosis is seen in (B), and fibrosis focally OP (arrows) with hemorrhage in C). H&E, bars 200, 100 µm