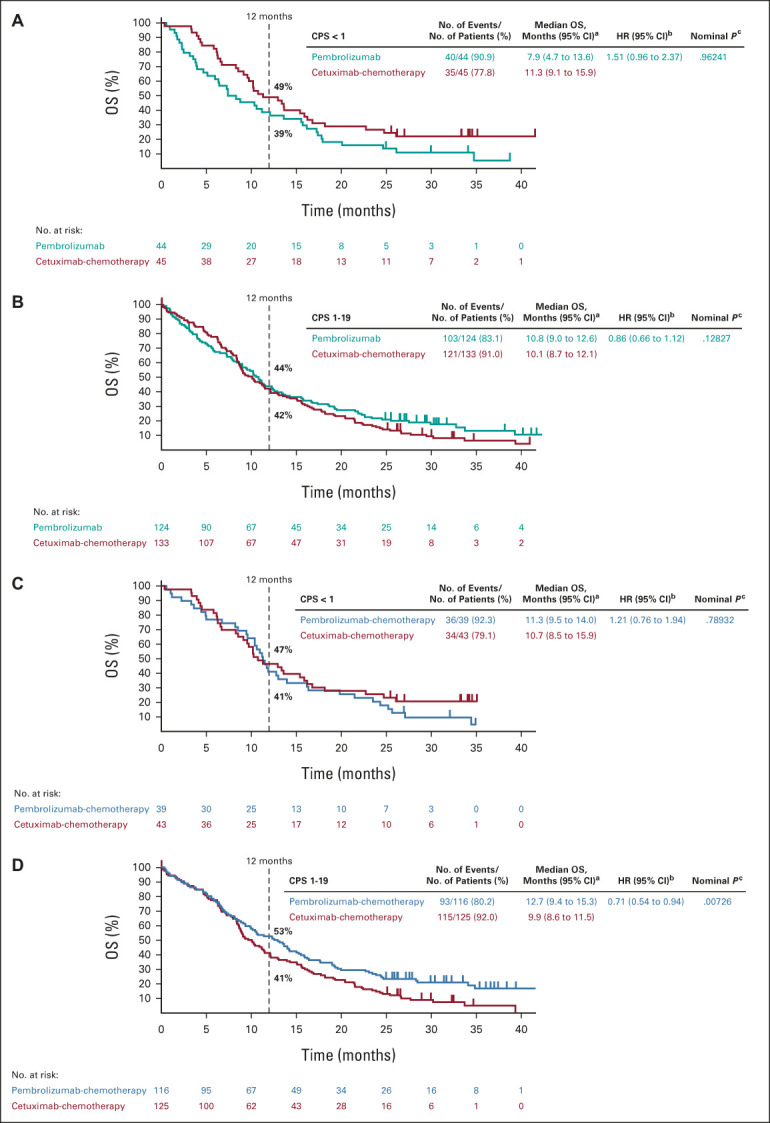
FIG 2.

Kaplan-Meier estimates of OS. Tick marks show censoring of the data at the last time the participant was known to be alive. Pembrolizumab alone versus cetuximab-chemotherapy in the (A) PD-L1 CPS < 1 subgroup and (B) PD-L1 CPS 1-19 subgroup. Pembrolizumab-chemotherapy versus cetuximab-chemotherapy in the (C) PD-L1 CPS < 1 subgroup and (D) PD-L1 CPS 1-19 subgroup. Kaplan-Meier estimates of OS in the PD-L1 CPS ≥ 20 subgroup at final analysis have been published previously.11 aFrom the product-limit (Kaplan-Meier) method for censored data. bBased on a Cox proportional hazards model with the Efron method of tie handling with treatment as a covariate. cOne-sided P values based on the log-rank test. All P values for the PD-L1 CPS < 1 and CPS 1-19 subgroups are nominal and are presented as a measure of the strength of the association between the end point (OS) and the treatment effect. CPS, combined positive score; HR, hazard ratio; OS, overall survival; PD-L1, programmed death ligand-1.
