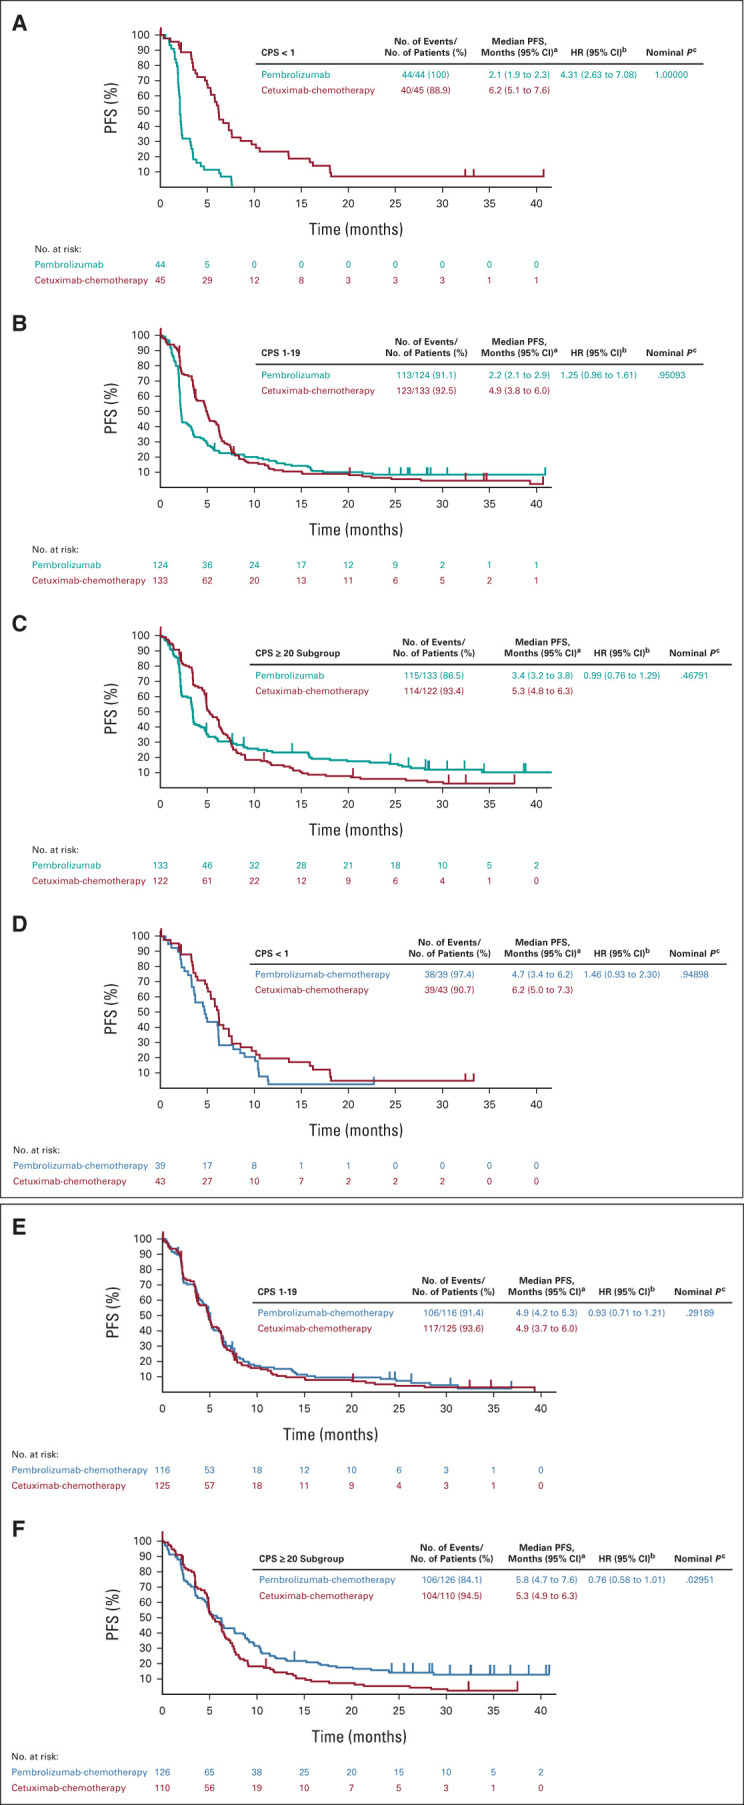
FIG 3.

Kaplan-Meier estimates of PFS assessed per RECIST v1.1 by blinded independent central review. Tick marks show censoring of the data at the time of the last imaging assessment. Pembrolizumab alone versus cetuximab-chemotherapy in the (A) PD-L1 CPS < 1 subgroup, (B) PD-L1 CPS 1-19 subgroup, and (C) PD-L1 CPS ≥ 20 subgroup. Pembrolizumab-chemotherapy versus cetuximab-chemotherapy in the (D) PD-L1 CPS < 1 subgroup, (E) PD-L1 CPS 1-19 subgroup, and (F) PD-L1 CPS ≥ 20 subgroup. aFrom the product-limit (Kaplan-Meier) method for censored data. bBased on a Cox proportional hazards model with the Efron method of tie handling with treatment as a covariate. cOne-sided P values based on the log-rank test. All P values for the PD-L1 CPS < 1 and CPS 1-19 subgroups are nominal and are presented as a measure of the strength of the association between the end point (PFS) and the treatment effect. Definitive results in the PD-L1 CPS ≥ 20 population have been published previously.11 CPS, combined positive score; HR, hazard ratio; PD-L1, programmed death ligand-1; PFS, progression-free survival.
