Figure 3.
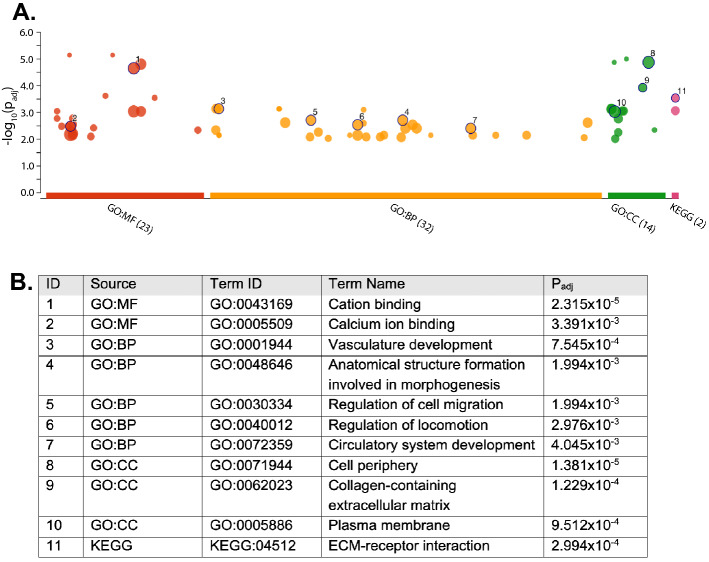
Gene enrichment analysis: functional terms and KEGG pathways. (A) g:Profiler Manhattan plot. The x axis shows the functional terms (term size greater than 50), grouped and colour-coded by data source (red = GO molecular function, orange = GO biological process, green = GO cellular component, pink = KEGG database). The position of terms in the plots is fixed and terms from the same gene ontology branch are close to each other. The size of circles shows the corresponding term size. Numbers correspond to the terms in the table below; the full list of terms is available in Supplementary Table 3. (B) Legend gene enrichment analysis. The table shows the ID referred to the Manhattan plot above, source database, term ID, term name, adjusted p values after FDR correction. See Supplementary Table 3 for the full list of terms.

