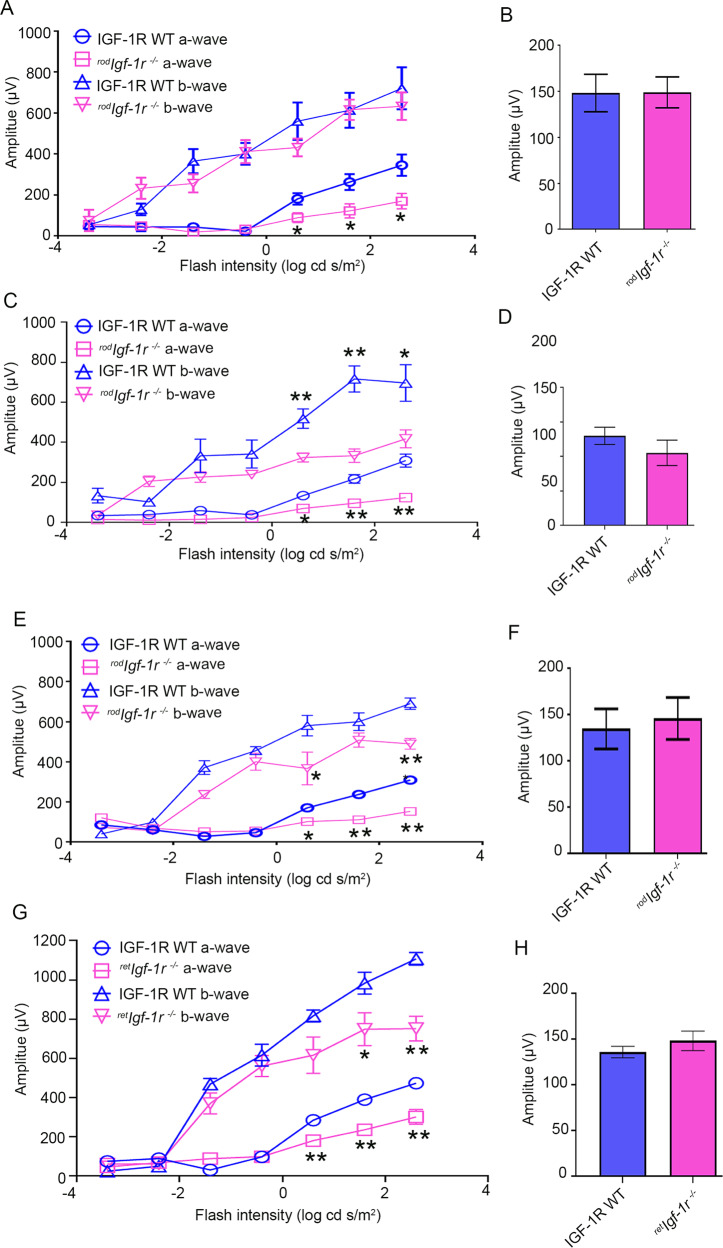
Fig. 2. Characterization and retinal function of rodIgf-1r−/− mice.
Scotopic a-wave (A, C, E), scotopic b-wave (A, C, E), and photopic b-wave (B, D, F) analyses were performed on 1-month-old (A, B), 4-month-old (C, D), and 6-month-old (E, F) IGF-1R-WT and rodIgf-1r−/− mice. Six-week-old IGF-1R-WT and retIgf-1r−/− mice were subjected to ERG and we measured scotopic a-wave, scotopic b-wave (G), and photopic b-wave (H) amplitudes. Scotopic a-wave and scotopic b-wave amplitudes were carried out at different flash intensities (−3.4, −2.4, −1.4, −0.4, 0.6, 1.6, and 2.6 log cd s/m2), whereas photopic b-wave amplitudes were performed at a flash intensity of 3.3 log cd s/m2. Data are mean ± SEM (n = 8). Two-way ANOVA was used to determine the statistical significance. The data were corrected for multiple comparisons by controlling the False Discovery Rate using a two-stage linear step-up procedure of the Benjamini, Krieger, and Yekutieli test. *p < 0.05; **p < 0.001.

