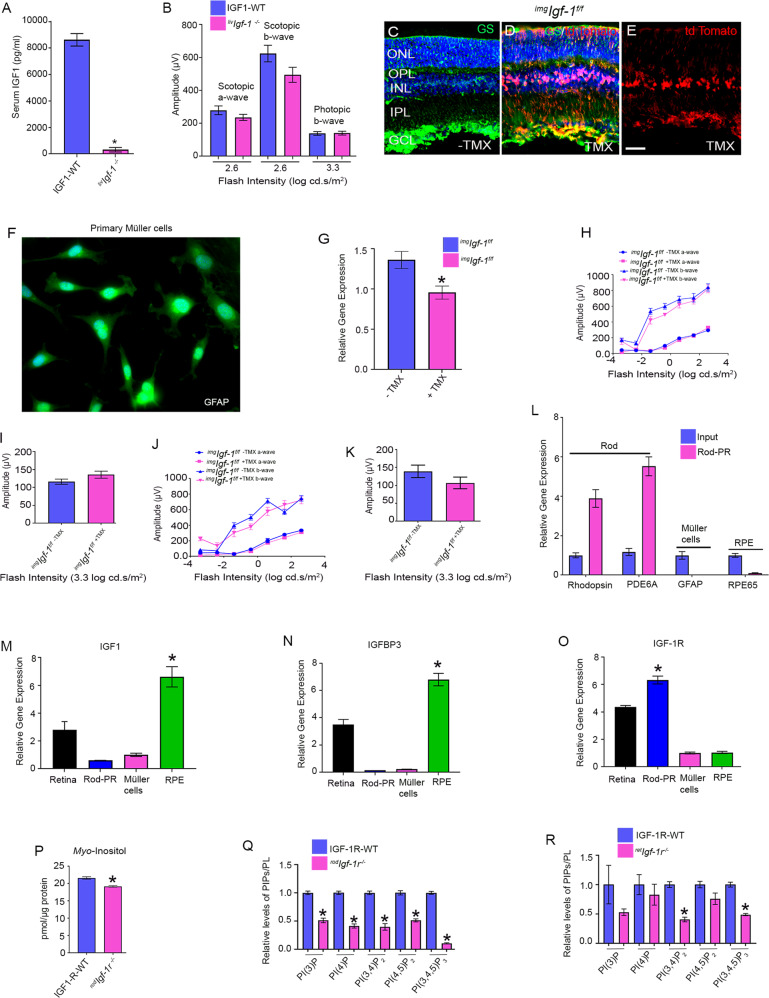
Fig. 5. Biochemical and functional studies of IGF-1 and IGF-1R.
Serum IGF-1 levels were measured from 2-month-old IGF-1-WT and livIgf-1−/− mice (A). Data are mean ± SEM, (n = 5). Welch’s t-test was used to determine the significance of these two groups. *p < 0.01. Eight-week-old IGF-1-WT and livIgf-1−/− mice were subjected to ERG and we measured scotopic a-wave, scotopic b-wave, and photopic b-wave amplitudes (B). Data are mean ± SEM, (n = 12). Unpaired nonparametric Mann-Whitney test was used to determine the significance between these two groups, but there was no significant difference. Tamoxifen-inducible GLAST-Cre mediated expression of tdTomato. Two-month-old Ai9 mice expressed robust tdTomato fluorescence following TMX-inducible Cre-mediated recombination. GLAST-tdTomato mice induced with TMX (D, E) and without TMX (C). Sections were stained with GS (green) (C, D). Red represents the intrinsic fluorescence. E This is the same as D, without DAPI. Scale bar = 50 µm. Primary Müller cell cultures were prepared from postnatal day 7 (P7) C57Bl6 pups and immunostained with GFAP antibody (F). Primary Müller cell cultures were prepared from 2-month-old imgIgf-1−/− mice injected with either peanut oil or TMX. RNA was isolated from these cells and converted to cDNA followed by qRT-PCR with IGF-1 primers and the data were normalized to actin (G). Data are mean ± SEM (n = 3), *p < 0.038. imgIgf-1−/− mice with and without TMX-treatment were examined for function at 3.5 (H, I) and 5.5 (J, K) months and we measured scotopic a-wave, scotopic b-wave (H, J), and photopic b-wave amplitudes (I, K). Data are mean ± SEM (n = 18). Two-way ANOVA was used, corrected for multiple comparisons by controlling the False Discovery Rate using a two-stage linear step-up procedure of the Benjamini, Krieger, and Yekutieli test. There was no significant difference between these two groups. qRT-PCR analysis of the mRNA showed enrichment of rod-specific transcripts and depletion of transcripts from Müller cells and RPE (L). Data are mean ± SEM (n = 3). Multiple unpaired t-tests were used to compare the significance between the retina and rod enriched transcripts. *p < 0.0001. qPCR analysis of IGF-1 (M), IGFBP3 (N), and IGF-1R (O) expression was examined from 2-month-old C57Bl6 mouse retina, enriched photoreceptor cells, mouse RPE, and P7 mouse primary Müller cells. Data are mean ± SEM (n = 3). The statistical difference between various retinal cells was assessed by using one-way ANOVA. *p < 0.0001. Myo-inositol levels were determined from 6-week-old IGF-1R-WT and rodIgf-1r−/− mouse retinas (P). Data are mean ± SEM (n = 9). An unpaired t-test with Welch’s correction was used to determine the significance between these two groups. *p < 0.0001. Phosphoinositides levels in 3-month-old IGF-1R-WT, rodIgf-1r−/− (Q) and retIgf-1r−/− (R) mice were measured using an ELISA assay employing PI(3)P, PI(4)P, PI(3,4)P2, PI(4,5)P2, and PI(3,4,5)P3. Data are mean ± SEM (n = 3). Retinas were pooled from 5 mice and 15 mice were used for this experiment. An unpaired t test with Welch’s correction was used to determine the significance between these two groups. *p < 0.0001.

