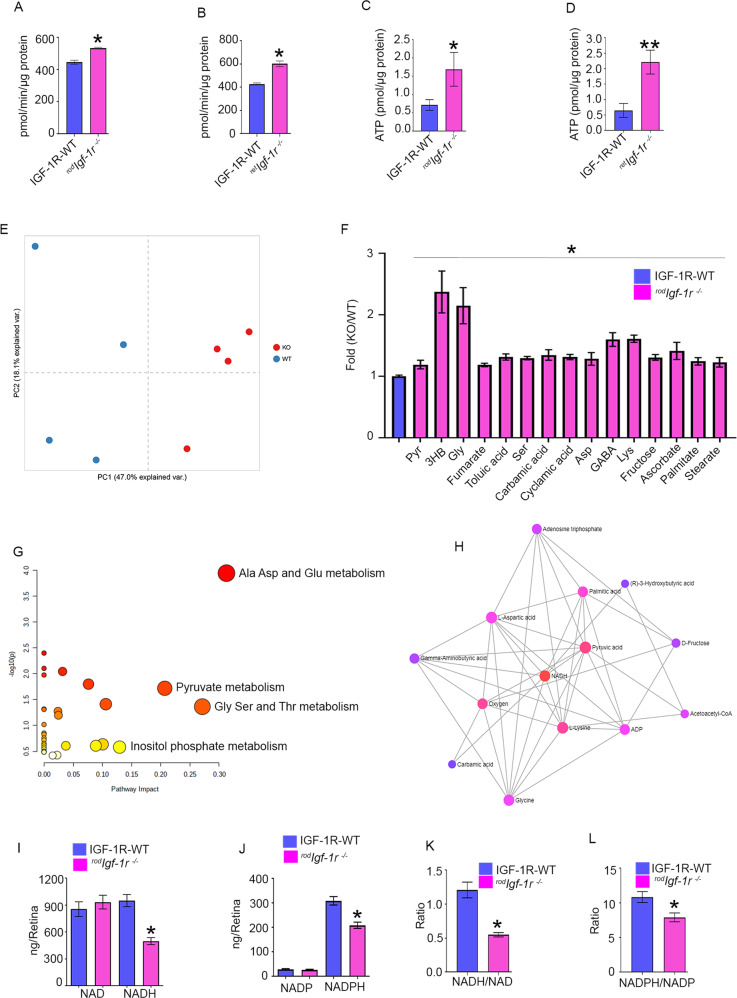
Fig. 6. Retinal metabolism in rodIgf-1r−/−mice.
Pyruvate kinase activity was measured from 2-month-old IGF-1R-WT, rodIgf-1r−/− (A) and retIgf-1r−/− (B) mice. Data are mean ± SEM (n = 12). Unpaired nonparametric Mann-Whitney test was used to determine the significance between these two groups. *p < 0.0001. ATP levels were measured from 2-month-old IGF-1R-WT, rodIgf-1r−/− (C) and retIgf-1r−/−mice (D). Data are mean ± SEM (n = 4). Unpaired nonparametric Mann-Whitney test (C) and unpaired parametric test with Welch’s correction (D) were used to determine the significance. *p < 0.05, **p < 0.01. Principal component analysis (PCA) of the samples based on 48 unique compounds demonstrated a clear separation between the tested groups (E). Steady-state level retinal metabolites were measured from 2-month-old IGF-1R-WT and rodIgf-1r−/− mouse retina (F) and data were subjected to a network (G) and interaction analysis (H). Data are mean ± SEM (n = 4). One-way ANOVA with the Kruskal-Wallis test was used to determine the significance. *p < 0.05. NAD, NADH (I), NADP, and NADPH (J) were measured from 2-month-old IGF-1R-WT mice and rodIgf-1r−/− mice, and NADH/NAD (K) and NADPH/NADP (L) ratios were calculated. Data are mean ± SEM (n = 9). Unpaired t test with Welch’s correction was used to determine the significance between these two groups. *p < 0.0001.

