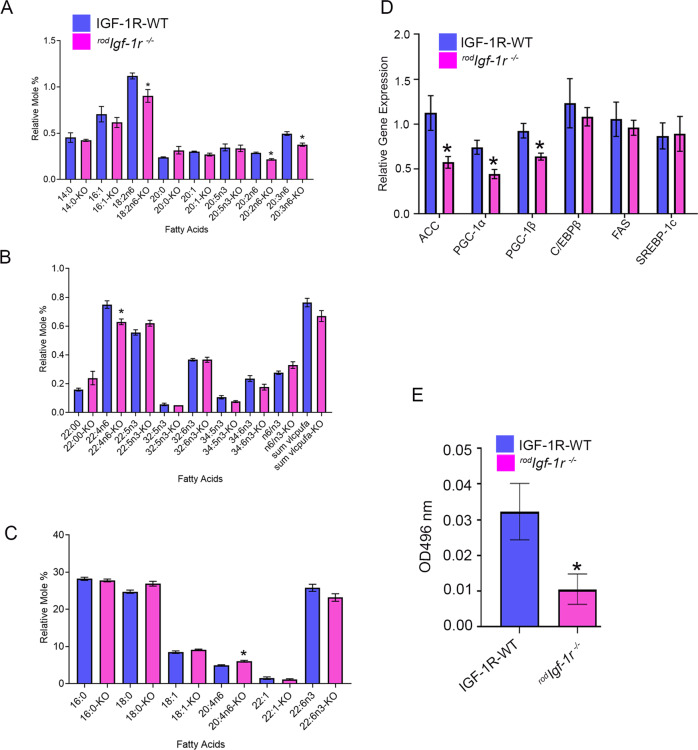
Fig. 7. Fatty acid profile, fatty acid synthesis genes, and fatty acid oxidation in rodIgf-1r−/− retinas.
Fatty acid profiles of two-month-old IGF-1R-WT and rodIgf-1r−/− mice were assessed (A–C), as described in the Materials and Methods section. Data are mean ± SEM (n = 3). An unpaired t-test with Welch’s correction was used to determine the significance between these two groups. *p < 0.05. qPCR analysis of fatty acid synthesis genes was performed using retinal cDNA prepared from 2-month-old IGF-1R-WT and rodIgf-1r−/− mouse RNA and the gene expression was normalized to 18S ribosomal RNA (D). Data are mean ± SEM (n = 3). Multiple unpaired t-tests were used to compare the significance between the groups. *p < 0.05. Fatty acid β-oxidation was measured in 2-month-old IGF-1R-WT and rodIgf-1r−/− mouse retinas (E). Data are mean ± SEM (n = 5). Unpaired nonparametric Mann-Whitney test was used to determine the significance. *p < 0.05.

