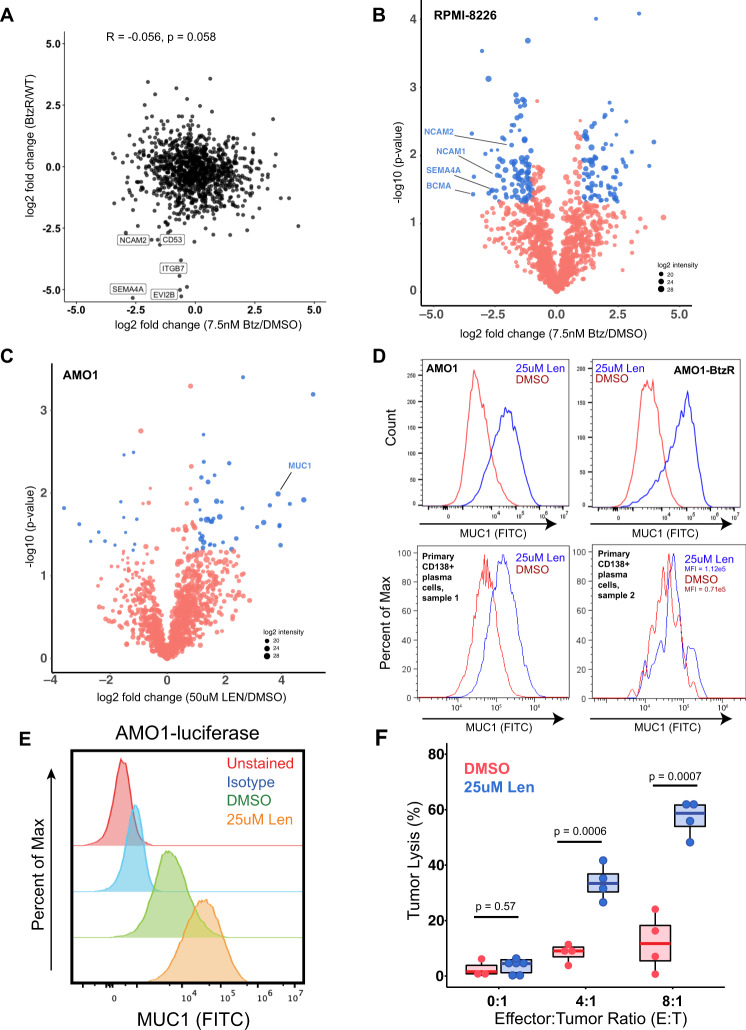
Fig. 5. Characterizing myeloma surface proteomic changes in response to acute drug treatment.
A Correlation in surface proteomic profile between acute Btz treatment in RPMI-8226 cells (7.5 nM, 48 h, n = 3 biological replicates) vs. DMSO (n = 4 biological replicates) and aggregate BtzR cell line data (as in Fig. 3A) vs. parental. Common changes are observed in some downregulated surface proteins but no significant overall correlation is observed. Pearson correlation and associated p-value of significance shown. Source data in Supplementary Data 3 and 5. B Volcano plot of RPMI-8226 cells treated for 48 h with 7.5 nM bortezomib, highlighting significantly changed proteins (log2-fold change > |1|; p < 0.05 in blue). n = 3 biological replicates. C Similar plot as in B, for 48 h treatment with 50 μΜ Lenalidomide in AMO1 cells. n = 3 biological replicates. For B, C, source data in Supplementary Data 5. D Validation of increase in surface MUC1 in plasma cells in response to 25 μM Lenalidomide treatment, in both AMO1, AMO1 BtzR, and CD138+ myeloma cells in two patient bone marrow aspirates. All plots representative of n = 3 (cell line) or n = 2 (primary sample) technical replicates. E MUC1 expression on cells treated with DMSO or Lenalidomide prior to incubation with anti-MUC1 CAR-T cells (representative of n = 2 independent experiments). F Percent tumor lysis of AMO1-luciferase cells after incubation with Anti-MUC1 CAR-T cells after 72 h, as measured by luminescence. Anti-MUC1 CAR-T cells more efficiently kill cells pre-treated with lenalidomide, while lenalidomide alone has no cytotoxicity (n = 4 technical replicates for E:T = 4:1 and E:T = 8:1, n = 8 technical replicates for E:T = 0:1, p-values by Student’s t-test). Source data are provided as a Source data file. Upper and lower hinges correspond to 25 and 75 percentiles, upper and lower whiskers extend to highest and lowest values, and center line indicates the median.

