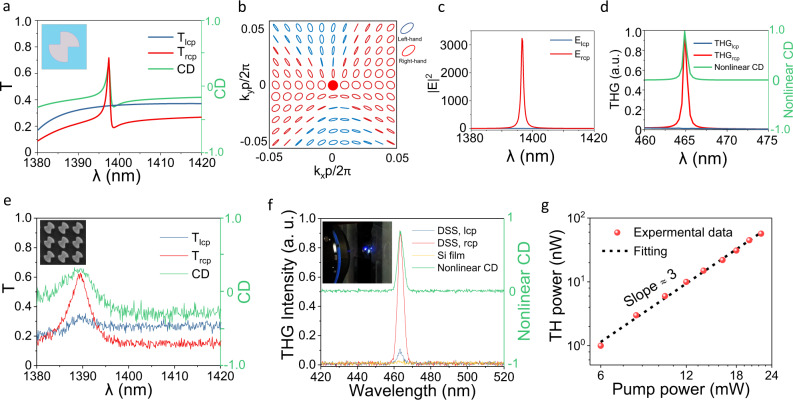
Fig. 5. Near-unity nonlinear CD with planar chiral q-BIC metasurface.
a Simulated transmission spectra of Tlcp and Trcp as well as the linear CD spectra of the metasurface with parameters P = 780 nm, R = 268 nm, L1 = 197 nm, L2 = 200 nm, W1 = 217 nm, W2 = 257 nm, and H = 654 nm with an asymmetric structure parameter (δ = 40 nm) for normal incidences. Insets show the Structure diagram. b The eigen-polarization profile in the k-space. The red dot represents the circular eigen-polarization (C point). c Contrast of electric field enhancement |E | 2 of different circularly polarized light. d Simulated THG intensity under different circularly polarized light incidence and the corresponding nonlinear CD. The nonlinear CD is defined as the normalized THG difference between RCP and LCP lights. e Measured transmission spectra of Tlcp and Trcp as well as the linear CD spectrum. Insets show the SEM image of the metasurface sample. f Experimentally measured THG intensities under RCP, LCP incidences in planar chiral q-BIC metasurface, THG intensity in a reference Silicon thin film, as well as the measured nonlinear CD spectra. The inset shows a photographic image of the light spot of THG from the sample. g Power dependence of THG in logarithmic scale showing cubic power scaling law. The red dots show the measured data, the black dashed line is a fit to the data with a third-order power function.

