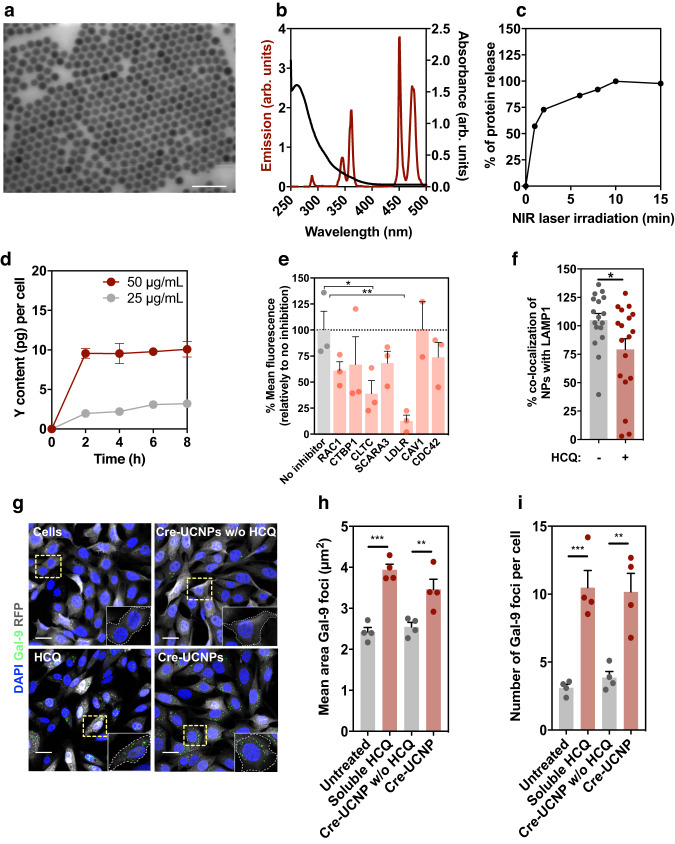
Fig. 2. Cellular uptake and intracellular trafficking of Cre-UCNPs.
a Representative STEM image of Cre-UCNPs, obtained from a total of 5 images. Scale bar = 100 nm. b Luminescence emission spectrum of UCNPs (red) and absorption spectra of PCL (black). c Protein release from Cre-UCNPs (50 μg/mL in PBS) was quantified by SDS-PAGE after activation by a NIR laser (785 mW/cm2) for a specific time. Results are expressed as Mean ± SEM (n = 3 technical replicates). d Cellular uptake. Quantification of yttrium (Y) by ICP-MS in fibroblasts exposed to different concentrations of Cre-UCNPs for a specific time, washed, harvested and finally freeze-dried. The delivered dose was normalized per cell number. Results are expressed as Mean ± SEM (n = 3 independent experiments, being the value of each independent experiment the average of three technical replicates). e Cellular uptake mechanism. Uptake of Cre-UCNPs in fibroblasts after silencing key regulators of clathrin-mediated endocytosis (CLTC and LDLR), caveolin-mediated endocytosis (CAV1), GEEC-CCLIC pathways (CDC42), macropinocytosis (RAC1 and CTBP1) and scavenger receptors (SCARA3) with siRNAs. Results were expressed as Mean ± SEM (n = 3 independent experiments) and analyzed by one-way ANOVA followed by Tukey’s multiple comparisons test: (*), P = 0.0229; (**), P = 0.0076. f Intracellular trafficking. Co-localization of Cre-UCNPs (stained with anti-Cre antibody) with intracellular vesicles labeled for LAMP1 after 5 min exposure. Results are expressed as Mean ± SEM (n = 17–18 images obtained from 3 technical replicates in 3 independent runs) and analyzed by a two-tailed t-test: (*), P = 0.0285. g Endolysosomal disruption and formation of galectin-9 foci. Representative confocal microscopy images of fibroblasts 24 h after incubation with Cre-UCNP (with or without immobilized HCQ on their surface) or soluble HCQ (26 µg/mL; 60 µM) for 16 h. Scale bars = 20 μm. h Mean area of galectin-9 foci larger than 2 µm2 and i total number of galectin-9 foci per cell. Results are expressed as Mean ± SEM (n = 2 independent experiments, each experiment with 2 technical replicates; 5-8 confocal images were acquired for each replicate). Statistical analysis was performed by one-way ANOVA followed by Tukey’s multiple comparisons test: in h, (**), P = 0.0084; (***), P = 0.0001; in i, (**), P = 0.0028; (***), P = 0.0008.

