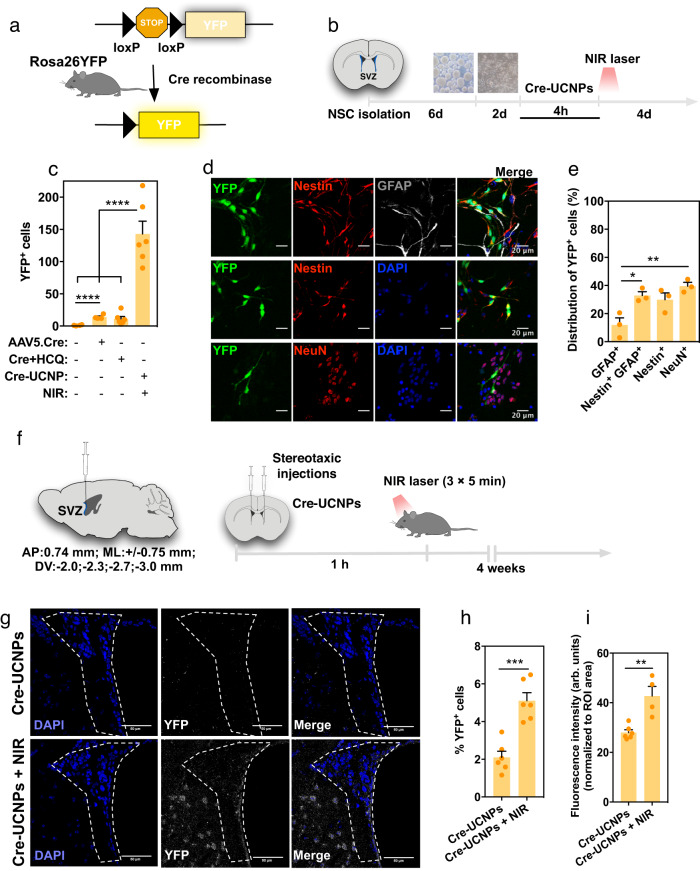
Fig. 4. Gene editing at SVZ region mediated by Cre-UCNPs.
a In vivo reporter system for Cre activity. The administration of Cre-UCNPs in the SVZ region of R26YFP mice, followed by the NIR laser exposure leads to the excision of a stop codon and consequent expression of YFP fluorescence reporter protein. b Schematic representation of the in vitro protocol to study the gene edition of SVZ cells by Cre-UCNPs. c Quantification of YFP-positive cells in SVZ cells transfected with: (i) Cre-UCNPs (200 µg/mL) followed by NIR laser activation, (ii) AAV or with (iii) soluble Cre in the presence of HCQ (concentrations equivalent to the cargo of 200 µg/mL Cre-UCNPs). Results are Mean ± SEM (2-3 independent experiments, each experiment with 2 technical replicates). d Colocalization of YFP with markers of SVZ cell sub-populations. YFP positive cells (green) were immunolabelled for Nestin (red), GFAP (gray) and NeuN (red). Representative images from 3 independent experiments. Scale bar = 20 μm. e Distribution of YFP-positive cells within SVZ cell sub-populations. Results are Mean ± SEM (n = 3 independent experiments, each one is average of two technical replicates). In (c) and (e), statistical analyses were performed by one-way ANOVA test followed by a Tukey´s multiple comparison test: (*), P = 0.0244; (**), P = 0.0052; (****), P < 0.0001. f Schematic representation of the animal protocol used to monitor in vivo gene editing in the SVZ region, 4 weeks after stereotaxic injection of Cre-UCNPs. g Representative confocal microscopy images of the SVZ region, from n = 2–3 animals. Cells labelled in yellow (stained by an anti-YFP antibody) were edited by Cre recombinase. Scale bar = 50 μm. h Percentage of anti-YFP stained positive cells. i Quantification of anti-YFP fluorescence intensity in SVZ region tissues. Results are Mean ± SEM (n = 2-3 animals per condition, 2 injections per animal, 4 photos per injection; intensity normalized to ROI). Data in h and i were analyzed by an unpaired two-tailed t test: (**), P = 0.0027 (***), P = 0.0002.

