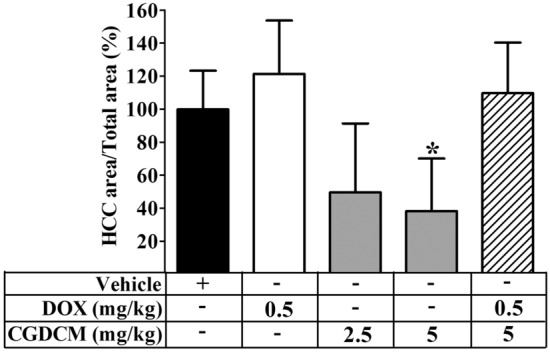
Figure 9.

Quantitative examination of the prevalence of HCC. Liver H&E sections at the end of the treatments (week 16) were scanned by Zeiss Axio Scan Z1 (Zeiss, Germany) and measured the area by the METAVIR scoring system (ZEN blue 2.3). Histograms show the relative HCC area (%). The vehicle group was treated with 0.8% DMSO. DEN administration was performed for 8 weeks, and the treatments were performed for 4 weeks from week 12, which included DOX, CGDCM-L, CGDCM-H, and the combination of DOX with CGDCM-H. The data were analyzed using one-way ANOVA with Tukey’s HSD test and reported as the mean ± SD (n = 7), *p < 0.05 compared to the vehicle at week 0. CGDCM, C. gigantea dichloromethane extract; CGDCM-L, CGDCM low dose; CGDCM-H, CGDCM high dose; DOX, doxorubicin.
