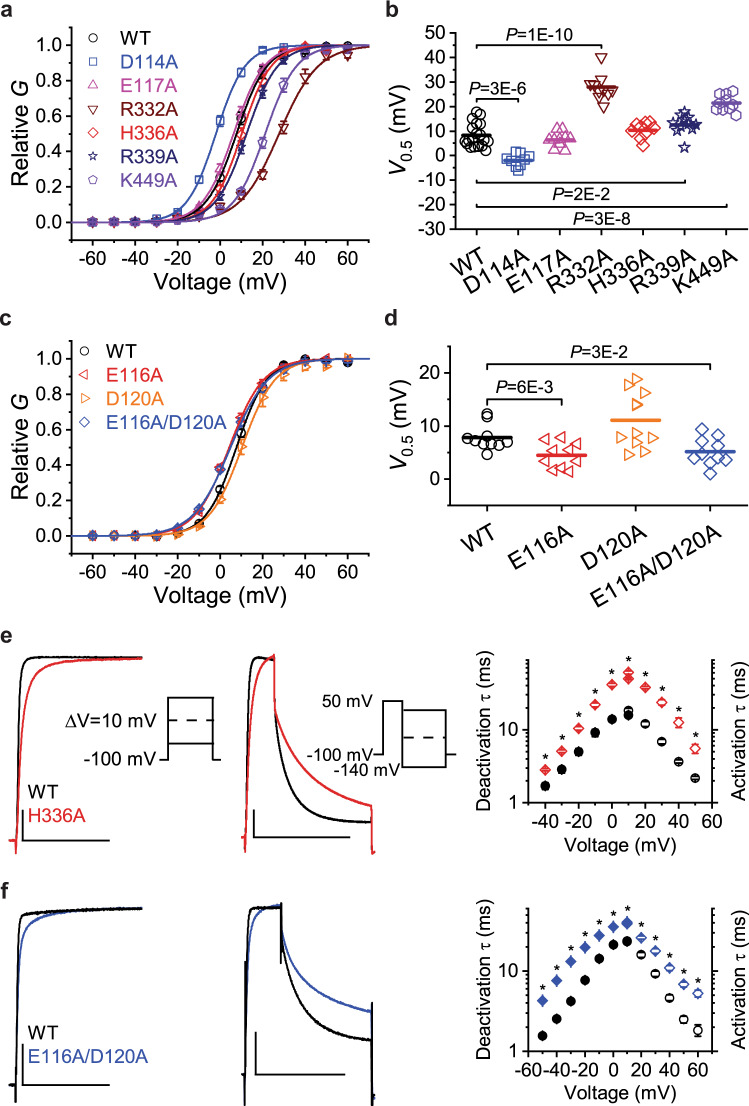
Fig. 6. Mutational and electrophysiological analyses of key residues involved in functional inter-domain interactions between α6, S4/S5 linker and S6T.
a Normalized G–V curves (G/Gmax) of Kv3.1a WT and the indicated mutants. The symbols and error bars represent mean ± SEM (n = 9–19 oocytes), and the solid lines are the best fits assuming a first-order Boltzmann equation (see the “Methods” section). b Scatter graphs comparing of V0.5 values from WT and several Ala mutants. Each symbol represents a measurement from an individual oocyte, and the overlaid horizontal line represents the mean value. In each group, n = 9-19 oocytes. P values are indicated on the graph. c Normalized G–V curves for the indicated α6 mutations as described for panel (a). In each group, n = 10-11 oocytes. d Scatter graph for the indicated α6 mutations as described for panel (b). In each group, n = 10–11 oocytes. e Left: Overlay of representative whole-oocyte currents from Kv3.1a WT and the mutant H336A at 50 mV. These currents were evoked by the voltage protocol shown in the inset. Centre: Overlay of representative whole-oocyte currents from Kv3.1a WT and the mutant H336A while the repolarizing voltage is 0 mV. From a holding voltage of −100 mV, these currents were evoked by a 30-ms step depolarization to +50 mV, which was immediately followed by a 100-ms repolarizing step. To determine the voltage dependence of deactivation, the repolarizing step was changed in 10-mV increments from −140 to +30 mV (inset). The horizontal and vertical scale bars indicate 100 ms and 1 μA, respectively. Right: The voltage dependence of the time constants of activation (hollow symbols) and deactivation (filled symbols) from Kv3.1a WT and H336A. f Left and centre: overlay of representative whole-oocyte currents from Kv3.1a WT and the double mutant E116A/D120A. Protocol details as described for panel (e). The horizontal and vertical scale bars indicate 100 ms and 1 μA, respectively. Right: The voltage dependence of the time constants of activation (hollow symbols) and deactivation (filled symbols) from Kv3.1a WT and E116A/D120A. Symbols and error bars in panels e and f represent the mean ± SEM and * indicates p < 0.001. Source data are provided as a Source Data file. Exact n and p values for panels a–d are listed in Supplemental Table 2.

