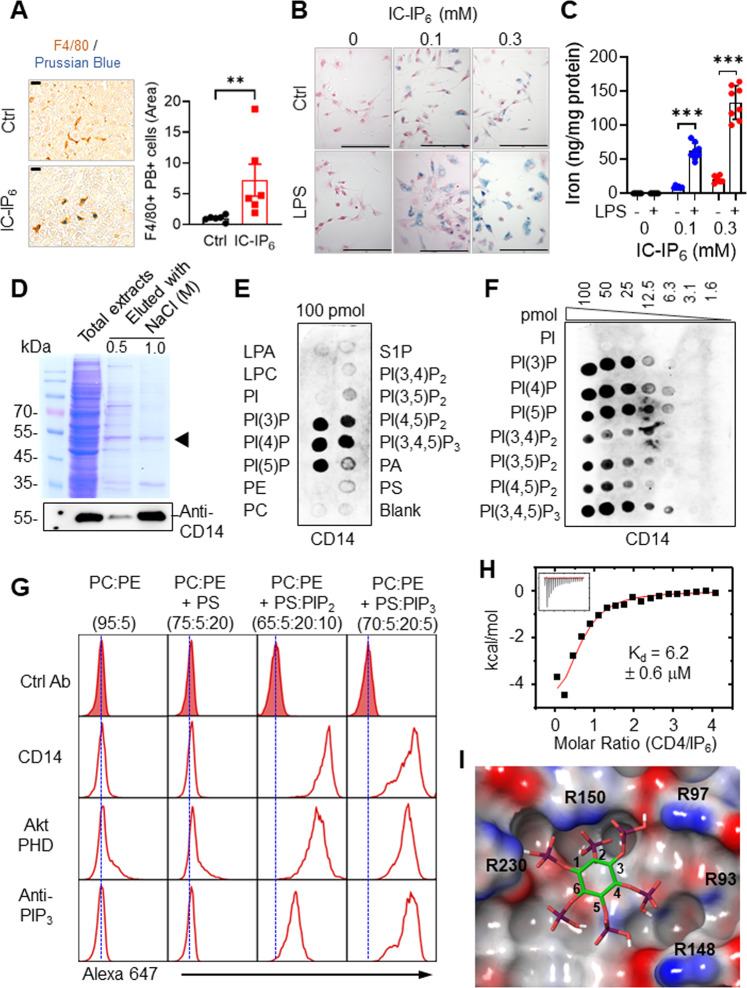
Fig. 1. The role of CD14+ macrophages in IC-IP6 uptake and PIP recognition.
Representative liver sections (left) and quantitative data (right) from mice treated with or without intravenous IC-IP6 (n = 6 per group). The liver sections were stained with Prussian blue (PB) for iron and anti-F4/80 antibodies for macrophages/Kupffer cells (scale bars, 20 μm). F4/80+ PB+ cells were quantified using ImageJ software. B, C LPS induction of IC-IP6 uptake by TPMs, determined by PB-stained cells (scale bars, 20 μm) (B), or (C) by iron staining with 2,4,6-tri-(2-pyridyl)-5-triazine (TPTZ) in cell lysates (n = 8). Each point represents the mean of three experimental replicates for each IC-IP6 concentration. D Proteins isolated from RAW264.7 cell lysates by IC-IP6 precipitation were eluted with NaCl, separated by SDS-PAGE, and visualized using Coomassie Brilliant Blue (black arrowhead = CD14). CD14 identity was confirmed by western blotting. E, F CD14 binding to immobilized phospholipids (100 pmol each) (E), and varying concentrations of phosphatidylinositol phosphates (PIP strips or PIP arrays, Echelon Biosciences) (F). G Representative flow cytometry analyses of the binding of CD14, AKT PHD, or anti-PIP3 antibody to the indicated phospholipids. Silica particles loaded with specific combinations of phospholipids (Echelon Bioscience) were treated with anti-PI(3,4,5)P3 antibody or His-tagged AKT PHD, or CD14 protein. Samples with His-tagged proteins were treated with primary anti-His antibody, and all were visualized using an Alexa-647-labeled secondary antibody. The blue dotted lines indicate the peaks of the isotype controls. H ITC results for IP6 titration into 30 μM CD14; the Kd value was determined by curve fitting the raw data (n = 2; MicroCal). I Modeled PI(3,4,5)P3-CD14 structure, generated with AutoDock PyRx and coordinates for IP6 (1ZY7) [50] and CD14 (1WWL) [35]; red (acidic) and blue (basic) are according to the electrostatic potential. IP6 potentially interacts with CD14 residues R92, R97, R150, and R230. All comparisons were performed by one-way ANOVA with Tukey’s post-hoc multiple comparison test (Fig. 1C) or unpaired student t test (Fig. 1A). All data are presented as mean ± standard deviation (SD) for each group. *p < 0.05, **p < 0.01, ***p < 0.001 compared to controls. See also Supplementary Fig. 1.

