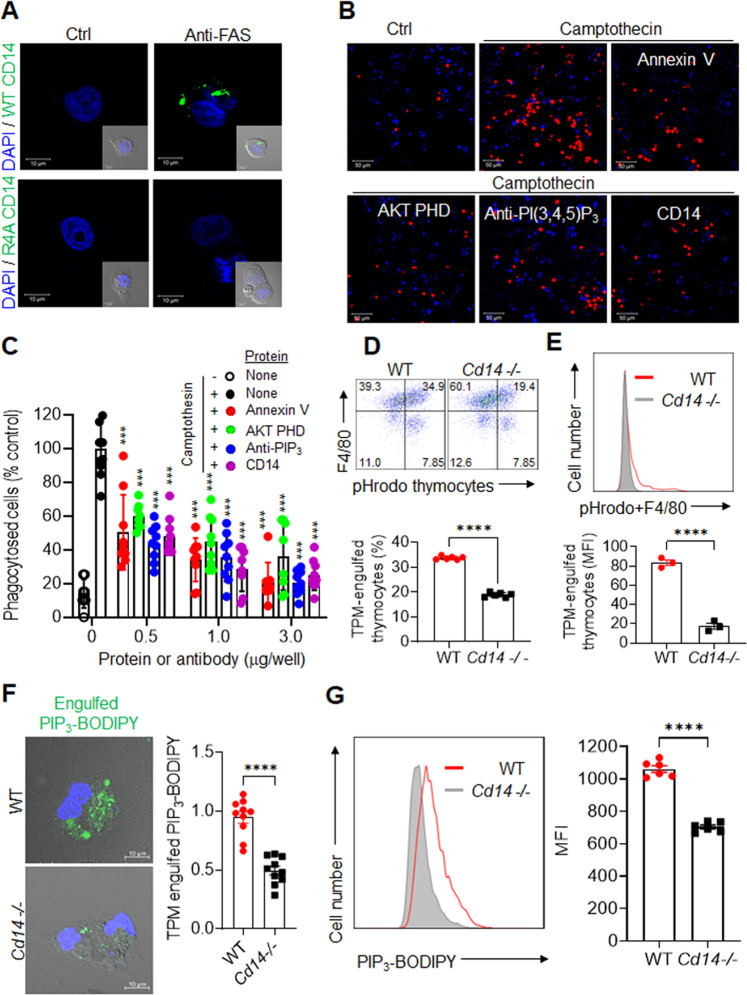
Fig. 3. PIP externalization and its role in phagocytosis.
A Representative images of apoptotic cell detection by recombinant WT CD14 or mutant R4A CD14 protein. After inducing apoptosis with an anti-FAS antibody (100 ng/ml), HeLa cells incubated with recombinant WT or R4A CD14 were visualized using an anti-CD14 primary antibody and an FITC-labeled secondary antibody (scale bars, 10 μm). B Representative images of TPM phagocytosis of camptothecin-treated, pHrodo-labeled Jurkat cells using an antibody or recombinant proteins to mask externalized PS or PIPs. TPM phagocytosis of camptothecin-treated, pHrodo-labeled Jurkat cells was inhibited by an anti-PI(3,4,5)P3 antibody, AKT PHD, Annexin V, and CD14 (scale bars, 50 μm). The red color represents engulfed apoptotic cells labeled with pHrodo dyes. C TPM phagocytosis of camptothecin-treated, pHrodo-labeled Jurkat cells was quantified in 8–10 low-power fields (mean ± SD, n = 5–10). D Representative flow cytometric plots (left) and percentages (right) of F4/80+ TPM phagocytosis of pHrodo-labeled thymocytes isolated from irradiated WT or Cd14−/− mice group (n = 6 per group). Thymocytes from irradiated mice were labeled with pHrodo for 30 min prior to adding TPMs from WT or Cd14−/− mice for 1 hr (mean ± SD, n = 6). E Representative flow cytometry plots (upper) and MFI values (lower) of in vivo phagocytosis of pHrodo-labeled apoptotic thymocytes by F4/80+ mouse peritoneal macrophages of WT or Cd14−/− mice group (n = 3 per group). Thymocytes from irradiated mice were labeled with pHrodo for 30 min prior to injecting the peritoneal cavity of WT or Cd14−/− mice for 15 min. F Representative fluorescent images (left) and intensities (right) of engulfed synthetic Bodipy-labeled PI(3,4,5)P3 in TPMs from WT or Cd14−/− mice. Engulfed Bodipy-labeled PIP3 was visualized by confocal microscopy and quantified by fluorescence intensity using NIH ImageJ software (mean ± SD, n = 10) after incubating the TPMs with 1 μg of Bodipy-labeled PI(3,4,5)P3 per well for 30 min (scale bars, 10 μm). G Representative flow cytometric plots (left) and MFI values (right) of engulfed synthetic Bodipy-labeled PI(3,4,5)P3 in PI-/F4/80+ TPMs from WT or Cd14−/− mice (mean ± SD, n = 6). All comparisons were performed by one-way ANOVA with Tukey’s post-hoc multiple comparison test Fig. 3A) or unpaired student t tests (Fig. 4D–F). All data are presented as the mean ± SD for each group. *p < 0.05, **p < 0.01, ***p < 0.001, ****p < 0.0001 compared with camptothecin-treated controls. See also Supplementary Figs. 5–7.

