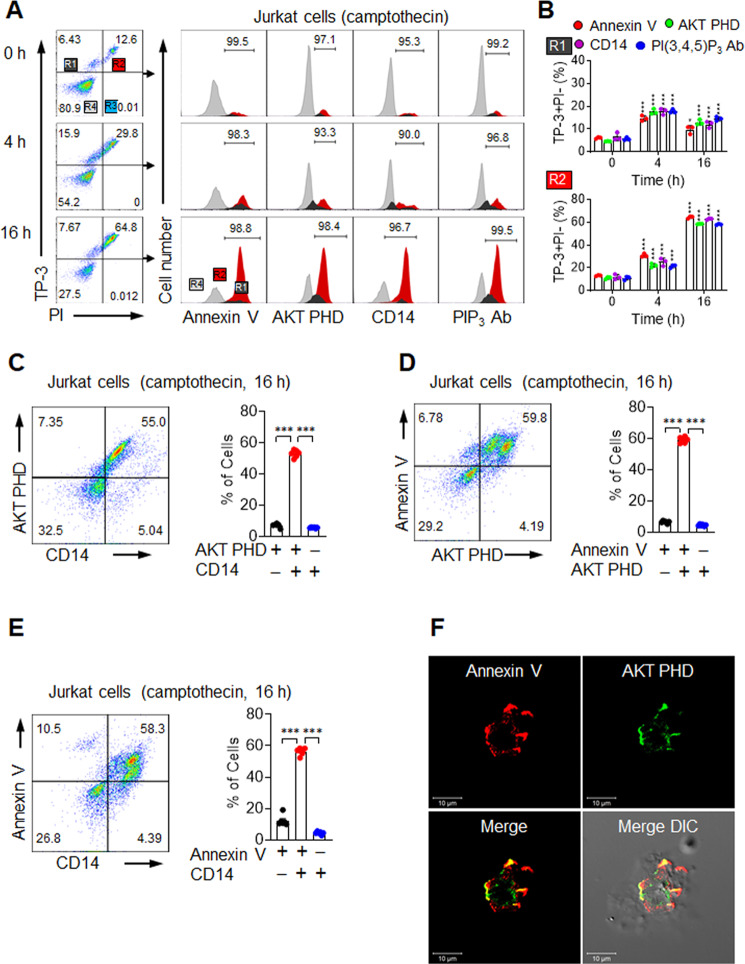
Fig. 4. In vitro induction of exofacial PIPs.
A, B Flow cytometric analyses of Jurkat cells treated 0–16 h with 10 μM camptothecin. A Representative flow cytometric plots (left) of TO-PRO-3 (TP-3) and propidium iodide (PI)-stained cells showing R1 (TP-3+PI−), R2 (TP-3+PI+), R3 (TP-3−PI+), and R4 (TP-3−PI−) subsets. Histograms (right) show the binding levels of Annexin V, AKT PHD, CD14, or PIP3 antibody in R1 (dark gray), R2 (red), and R4 (light grey) subsets. B Percentage of Annexin V, AKT PHD, CD14, and PI(3,4,5)P3 in R1 (upper low) and R2 (lower low) cells. C, D Flow cytometric analyses of Jurkat cells treated 16 h with 10 μM camptothecin. C Representative flow cytometric plots (left) and binding percentages (right) of an AKT PHD and CD14 combination. D Representative flow cytometric plots (left) and binding percentages (right) of an Annexin V and AKT PHD combination. E Representative flow cytometric plots (left) and binding percentages (right) of an Annexin V and CD14 combination. F CHO cells treated 6 h with 10 μM camptothecin and incubated with Annexin V and AKT PHD were detected with primary antibodies and Texas Red- or FITC-labeled secondary antibodies, respectively. See also Supplementary Fig. 8 and Supplementary Movie 2. All comparisons were performed by one-way ANOVA with Tukey’s post-hoc multiple comparison test. All data are presented as the mean ± SD for each group (n = 6 per group unless noted otherwise). *p < 0.05, **p < 0.01, ***p < 0.001 compared to double-positive subsets.

