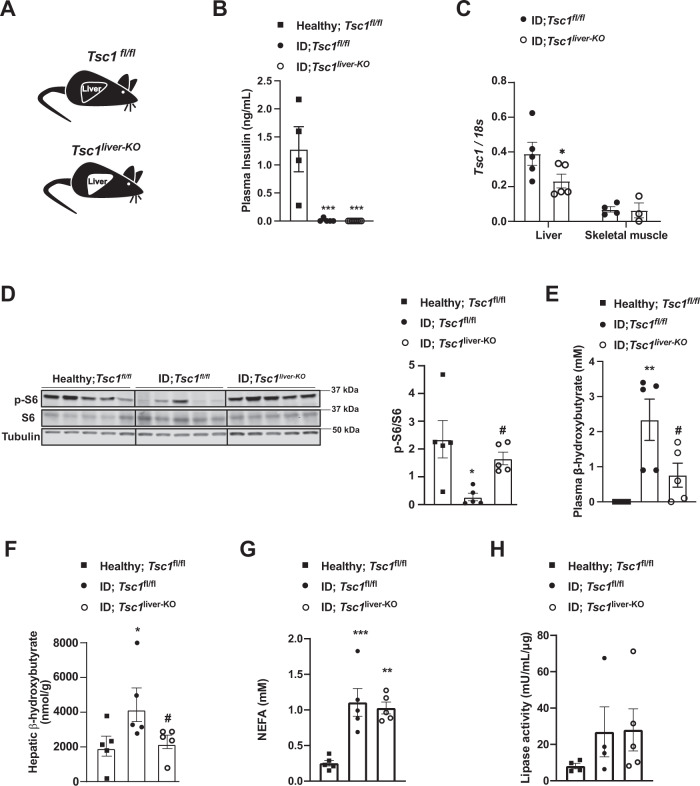
Fig. 3. Liver specific up-regulation of mTORC1 signaling prevents hyperketonemia in ID.
A Experimental groups. Homozygous Tuberous sclerosis complex 1 floxed (Tsc1fl/fl) mice were administered 1 × 10^9 PFU Adenovirus serotype 5 expressing Cre and GFP (Cre recombinantion results in a Tsc1 null allele in the liver of Tsc1fl/fl mice): Tsc1liver-KO. Control mice were treated with 1 × 10^9 PFU Adenovirus serotype 5 expressing only GFP: Tsc1fl/fl. B Plasma insulin levels of insulin deficient mice and healthy controls (p = 0.0003 and p = 0.0001). C mRNA content of Tcs1 in the liver (p = 0.0584) and skeletal muscle (gastrocnemius) of the indicated groups. D Image of immunoblot for the indicated proteins and phosphorylation states and relative densitometry quantification of pS6/S6 (p = 0.011, p = 0.05). E Plasmatic β-hydroxybutyrate levels of indicated groups (p = 0.008, p = 0.048). G Plasma NEFAs level (p = 0.008, p = 0.002). H Lipase activity from perigonadal fat. (n/group = 5, 5 and 5) Error bars represent SEM. Statistical analyses were done using one-way ANOVA (Tukey’s post-hoc test, except for F in which FDR was used) (* and # indicate comparison to healthy and to control mice, respectively), except for C for which analysis were done using a two- tailed unpaired Student’s t-test. *P < 0.05, **P < 0.01, ***P < 0.001, #P ≤ 0.05, ##P ≤ 0.01. Western blot images shown in D are cropped images. Source data are provided as a source data file.

