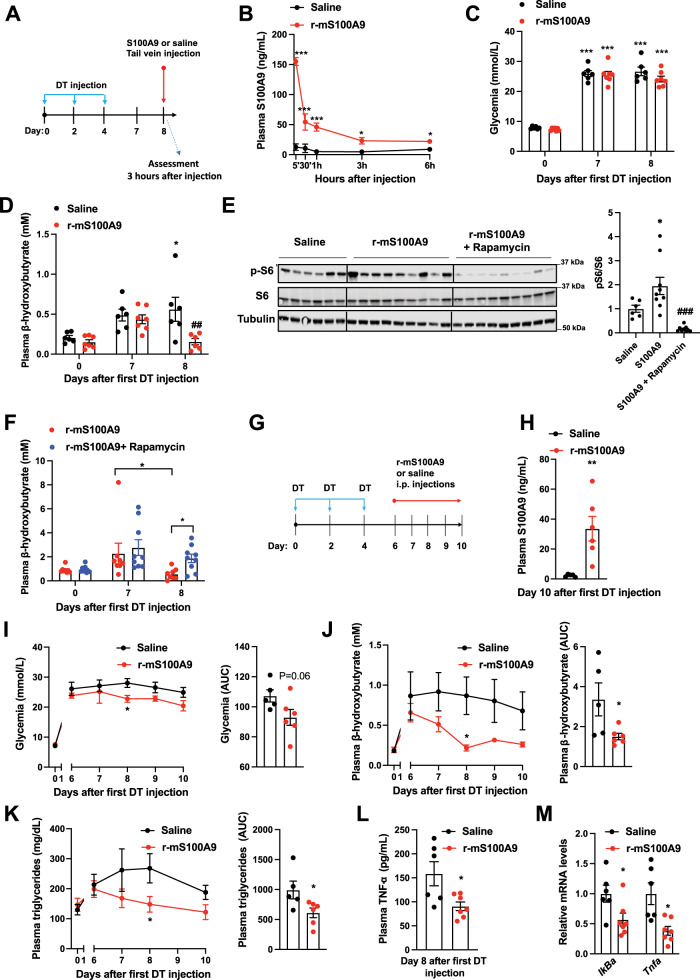
Fig. 6. Efficacy and safety of recombinant S100A9 administration in ID mice.
A RIP- DTR mice were treated at day 0, 2, and 4 with DT and at day 8, were injected via tail vein with either saline (n = 6) or 0.6 mg/kg of r-mS100A9 (n = 7) (alone or in combination with intraperitoneal injection with 10 mg/kg of rapamycin) (n/group = 6, 9 and 9). Metabolic assessments were done 3 h after injection and food removal. B Plasma level of S100A9 after injection of r-mS100A9 or saline (p = 0.001, p = 0.001, p = 0.001, p = 0.02, p = 0.03). C Glycemia (p = 0.001) and D plasma level of β-hydroxybutyrate of ID mice treated with 1 injection of r-mS100A9 or saline (p = 0.04 and p = 0.007). E Immunoblot from liver lysates and on the right bars indicating relative quantification of pS6/S6 (p = 0.012 and p = 0.0002). F Plasma level of β-hydroxybutyrate of ID mice treated with 1 injection of r-mS100A9 alone or in combination with rapamycin (rapamycin was injected at the same time of r-mS100A9 and values taken 3 h later) (p = 0.016 and p = 0.055). G RIP-DTR mice were treated at day 0, 2, and 4 with DT and starting from day 6, were intraperitoneally injected 2 times/day (9 am and 6 pm) with either 0.6 mg/kg of r-mS100A9 (n = 6) or saline (n = 5) (200 μl total volume) and here we show their values of H plasma S100A9 (p = 0.008), I daily glycemia (p = 0.01) (and area and the curve of glycemia from day 6), and J daily ketonemia (p = 0.015 and p = 0.038) (and area and the curve of ketonemia from day 6), K Daily triglyceridemia (p = 0.048) and area under the curve of tryglyceridemia from day 6) (p = 0.042). L Plasma level of TNF-a, (p = 0.02) and M level of hepatic IkBa (p = 0.036) and Tnfa (p = 0.017) mRNA. In all groups, glycemia and plasma were obtained at noon after 3 h of food removal. Error bars represent SEM. In B–F and I–K, statistical analyses were done using one or two-ways ANOVA (Tukey’s post-hoc test) except in 6 F where FDR was used * and # indicate comparison to basal and to saline treatment (at the same time), respectively. Statistical analyses in H, L and M were done using a two-tailed unpaired Student’s t-test. *P < 0.05, **P < 0.01, ***P < 0.001, #P < 0.05, ##P < 0.01, ###P < 0.001. Source data are provided as a source data file.

