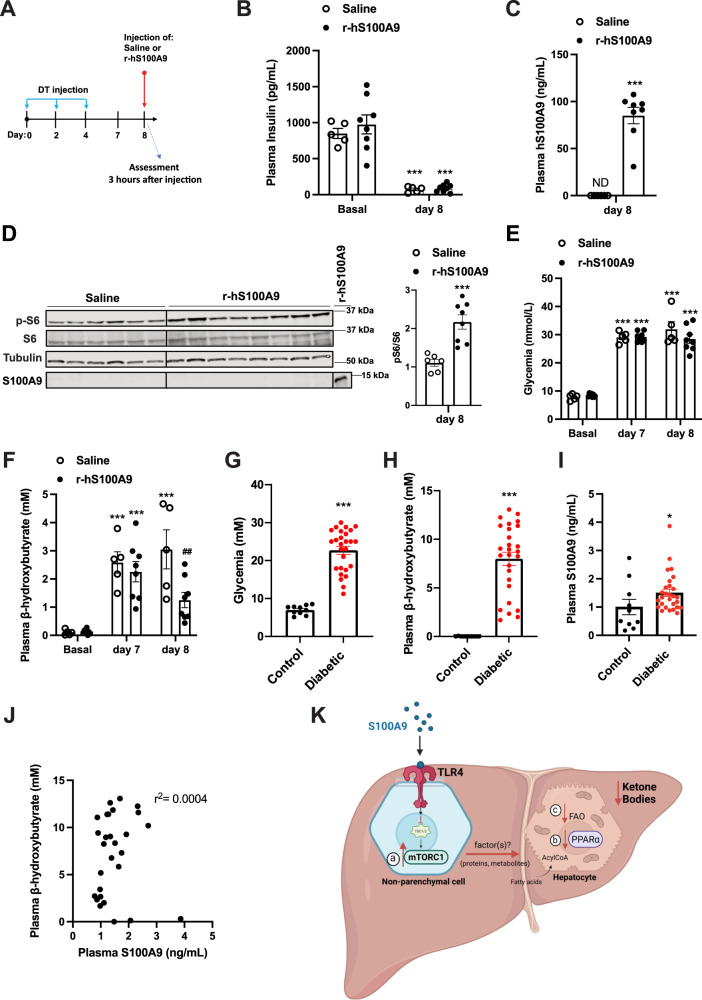
Fig. 7. Clinical relevance of recombinant S100A9 as an anti-diabetic therapeutic.
A RIP- DTR mice were treated at day 0, 2, and 4 with DT and at day 8, were injected via tail vein with either saline (n = 5) or 0.6 mg/kg of r-hS100A9 (n = 8). Metabolic assessments were done 3 h after injection and food removal. B Plasma insulin level (p = 0.0001), C human S100A9 plasma level (p = 0.0001), D indicated hepatic protein levels (p = 0.0006), E glycemia (p = 0.0001), and F ketonemia (p = 0.001, p = 0.001, p = 0.001 and p = 0.009), of ID mice treated with 1 injection of saline or r- hS100A9. G Glycemia (p = 0.0001). H Ketonemia (p = 0.0001), and I plasmatic S100A9 content in healthy (n = 10) and decompensated diabetic subjects (n = 23) (p = 0.034). J Correlation analysis between ketone and S100A9 levels in decompensated type 1 diabetic subjects. K Our model predicts that extracellular S100A9 activates non-parenchymal hepatic TLR4 signaling which consequently leads to several downstream events. These include a) activation of the mTORC1 pathway, b) dampening of the PPARα targets and c) reduction of fatty acid oxidation in hepatocytes all of which contribute to the significant regression of the elevated ketogenesis caused by pancreatic beta-cell loss/dysfunction. This figure was created with BioRender.com. Error bars represent SEM. Statistical analyses in C, D and G–I were done using two-tailed unpaired Student’s t-test. Statistical analyses in B, E and F were done using two-ways ANOVA (Tukey’s post-hoc test). * and # indicate comparison to basal and to saline treatment (at the same time), respectively (except when differently indicated: in F). The correlation analysis in J was performed by using Spearman rank-correlation test. *P < 0.05, **P < 0.01, ***P < 0.001, ##P < 0.01. Western blot images shown in D are cropped images. Source data are provided as a source data file.

