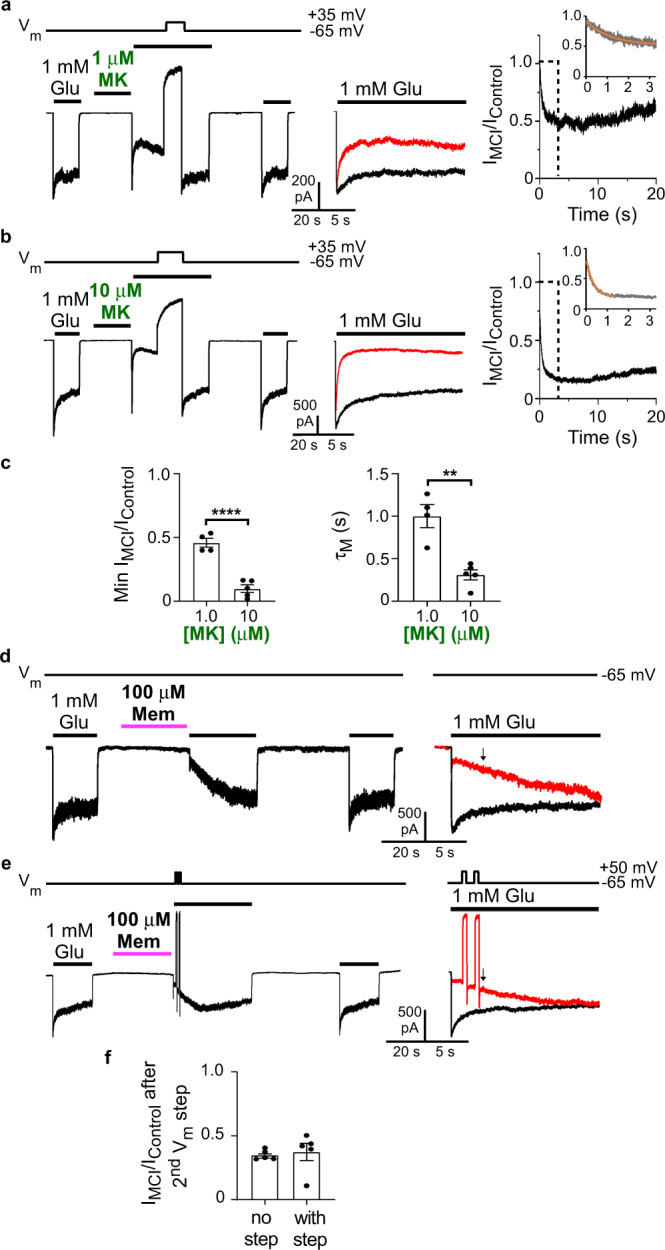
Fig. 4. Blockers transit from a reservoir of drug molecules to the NMDAR channel during MCI.

a–c Measurement of [MK-801] dependence of τM at pH 7.2. a, b MCI protocol with 1 μM (a) and 10 μM (b) MK-801. A ~20 s Vm step to 30 mV was performed after MK-801 application to allow full recovery from MK-801 inhibition. c Min IMCI/IControl with 1 μM (0.459 ± 0.035; n = 4) and 10 μM MK-801 (0.097 ± 0.029; n = 5) compared with two-sided t-test (t = 7.94, df = 7, p = 0.000096; left); τM of MCI onset with 1 μM (1002 ± 135 ms, n = 4) and 10 μM MK-801 (311 ± 59 ms, n = 5) compared with two-sided t-test (t = 5.06, df = 7, p = 0.0015; right). d, e Investigation of memantine reblock during recovery from MCI. Memantine was applied using the pH 9.0 jump protocol because of the higher memantine potency observed at elevated pH (Fig. 1). Amiloride was used with cells that exhibited significant proton-activated currents. d Control (no Vm jump) MCI protocol with 100 μM memantine (left), and overlays of IControl and IMCI (IMCI in red; right). e Same as d, except with two 500 ms Vm steps to 50 mV performed during recovery from MCI. Arrows in the overlays in d and e show time of IMCI/IControl measurement (time corresponding to 200 ms after the end of the second Vm step). f IMCI/IControl measured at the time shown by arrows in the overlays (IMCI/IControl: without Vm steps (d), 0.350 ± 0.017, n = 5; with Vm steps (e), 0.375 ± 0.069, n = 5) compared with two-sided t-test (t = 0.344, df = 8, p = 0.74). In c, f, mean ± SEM is plotted.
