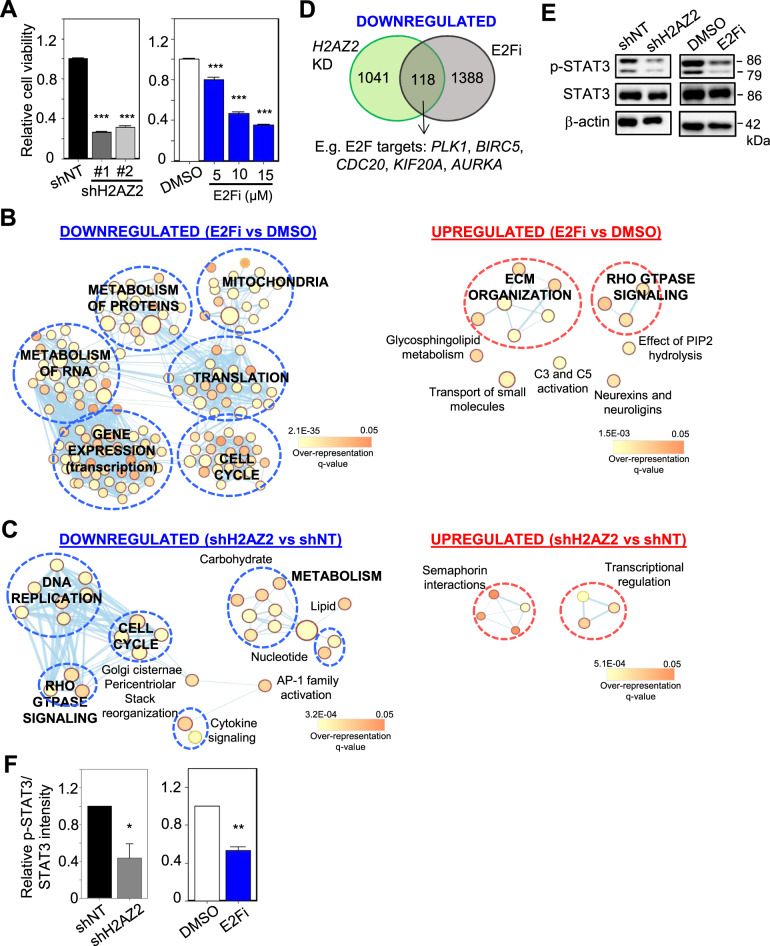
Fig. 4. E2F inhibition does not fully recapitulate the transcriptomic changes elicited by H2AZ2 KD.
A Cell viability assay of GSCs with H2AZ2 KD or 3 days of E2Fi treatment (n = 6) (mean ± SD). ***p < 0.001. Gene set enrichment map of pathways containing genes downregulated or upregulated upon 15 μM E2Fi (3 days) treatment (B) or H2AZ2 depletion (C) of GSC. Nodes represent gene sets (pathways) that were significantly enriched in the comparison treated vs. control samples (FDR < 0.05). D Venn diagram showing the number of overlapped genes among the downregulated genes upon 15 μM E2Fi treatment (3 days) or H2AZ2 depletion. E Western blot analysis of p-STAT3 and STAT3 protein levels in H2AZ2 KD or 15 μM E2Fi-treated GSC. F Quantification of p-STAT3 band intensities in (E) when normalized to the STAT3 control (n = 3) (mean ± SD). *p < 0.05; **p < 0.01. A, F Two-tailed unpaired Student’s t test.

