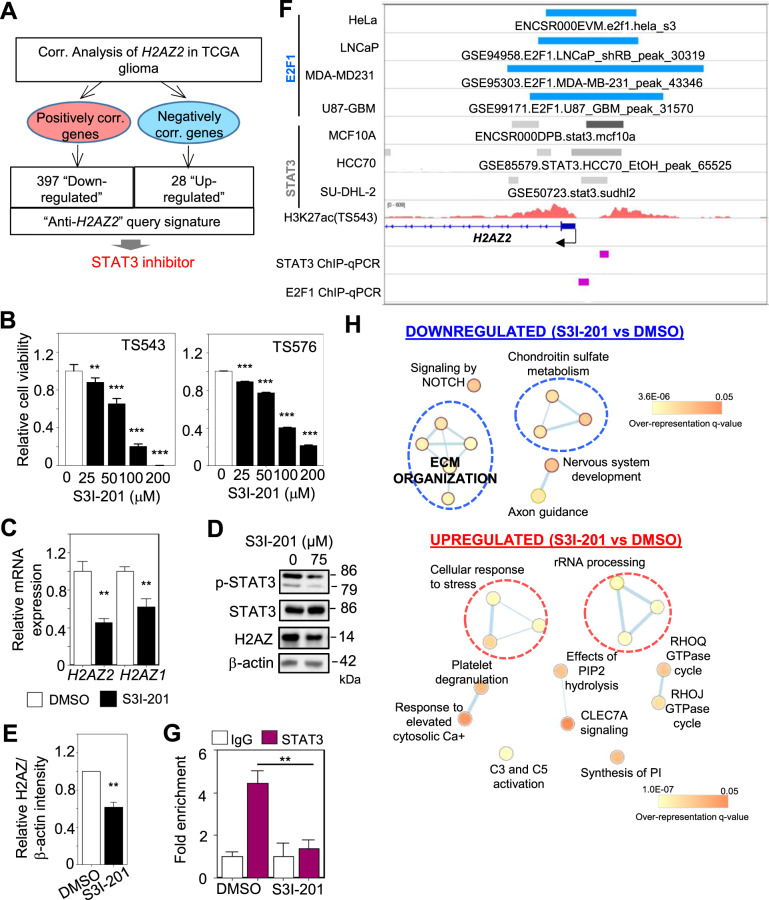
Fig. 5. A chemical biology approach identified STAT3 as another H2AZ2 transcriptional activator.
A CMA using the “anti-H2AZ2” gene signature identified STAT3 inhibitor that may downregulate a subset of H2AZ2-associated genes. B Cell viability assay of GSCs with 3 days of S3I-201 treatment (n = 8) (mean ± SD) **p < 0.01; ***p < 0.001. C qRT-PCR analysis of H2AZ2 and H2AZ1 mRNA levels upon S3I-201 treatment of GSC. HSP70 and TBP serve as the housekeeping genes (n = 3) (mean ± SD). **p < 0.005. D Western blot analysis of p-STAT3, STAT3, and H2AZ protein levels upon S3I-201 treatment of GSC. β-actin serves the loading control. E Quantification of H2AZ band intensities in (D) when normalized to β-actin control (n = 3) (mean ± SD). **p < 0.01. F E2F1, STAT3, and H3K27ac ChIP-Seq tracks for H2AZ2 in the indicated cell lines, along with the location of ChIP-qPCR primers. G ChIP-qPCR analysis of STAT3 occupancy on the H2AZ2 promoter upon S3I-201 treatment of GSC (n = 3) (mean ± SD). **p < 0.01. H Gene set enrichment map of pathways containing genes downregulated or upregulated upon 75 μM S3I-201 treatment of GSC (3 days). Nodes represent gene sets (pathways) that were significantly enriched in the comparison treated vs. control samples (FDR < 0.05). Two-tailed unpaired Student’s t test.

