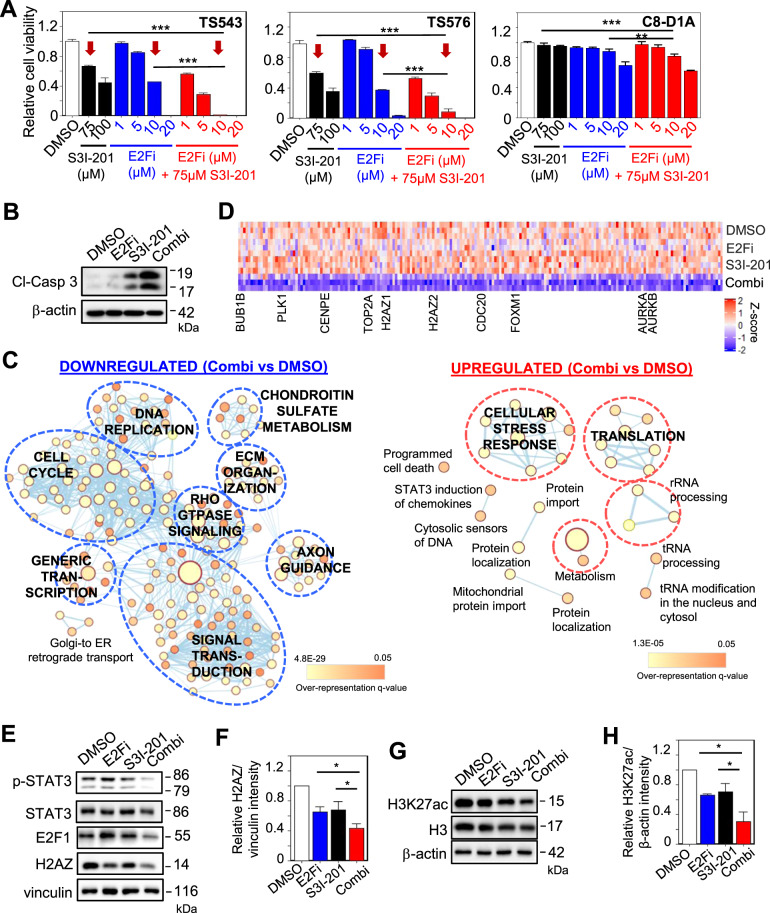
Fig. 6. S3I-201 synergizes with E2Fi in reducing H2AZ expression and GSC viability.
A Cell viability assay of GSCs and mouse astrocytes with 3 days treatment of S3I-201, E2Fi, or E2Fi/S3I-201 combination at the indicated concentrations (n = 8) (mean ± SD). ***p < 10e−5. B Western blot analysis of cleaved-caspase 3 protein levels with the respective drug treatment of GSC. β-actin serves the loading control. C Gene set enrichment map of pathways containing genes downregulated or upregulated upon 75 μM S3I-201/10 μM E2Fi combination treatment of GSC (3 days). Nodes represent gene sets (pathways) that were significantly enriched in the comparison treated vs. control samples (FDR < 0.01). D Heat map of cell cycle gene expression with DMSO, 10 μM E2Fi, 75 μM S3I-201, and 10 μM E2Fi + 75 μM S3I-201 (3 days) treatment of GSC. E Western blot analysis of p-STAT3, STAT3, E2F1, and H2AZ protein levels with the respective drug treatment of GSC. Vinculin serves the loading control. F Quantification of H2AZ band intensities in (E) when normalized to the vinculin control (n = 3) (mean ± SD). *p < 0.05. G Western blot analysis of H3K27ac and H3 protein levels with the respective drug treatment of GSC. β-actin serves the loading control. H Quantification of H3K27ac band intensities in (G) when normalized to the β-actin control (n = 3) (mean ± SD). *p < 0.05. A, F, H Two-tailed unpaired Student’s t test.

