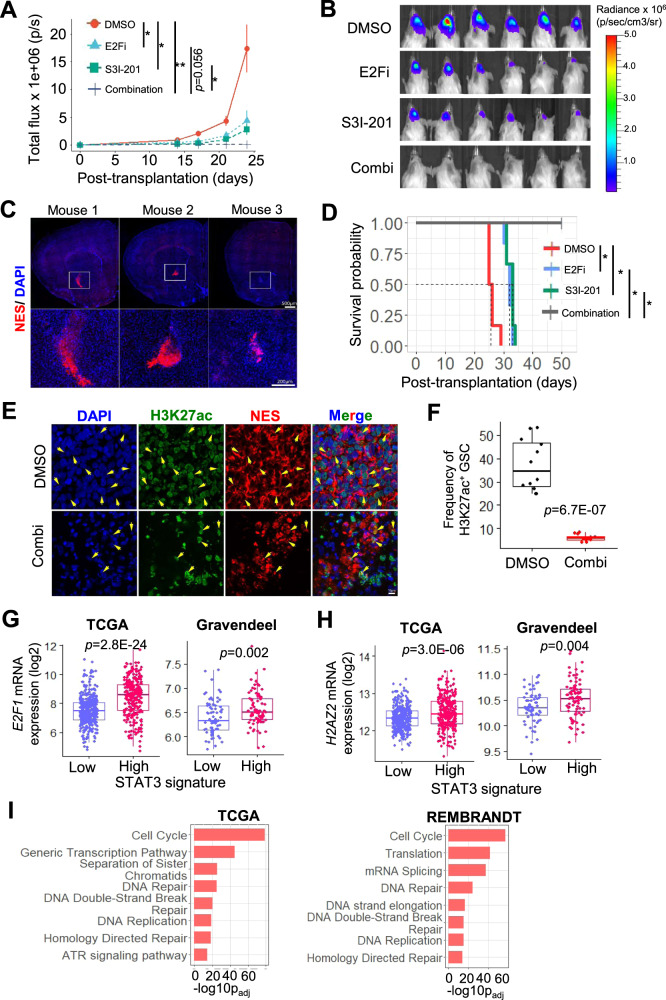
Fig. 7. S3I-201/E2Fi combination potently and durably impairs GSC tumorigenicity.
Quantification of tumor volume based on in vivo bioluminescence-based imaging (A) and representative images (B) of the tumor-bearing mice at 24 days posttransplantation (n = 6) (mean ± SD). The mice were challenged with of DMSO, 10 μM E2Fi, 75 μM S3I-201, or 10 μM E2Fi + 75 μM S3I-201-treated GSC TS543 (1 × 10⁵ cells; 3 days treatment). Two-tailed unpaired Student’s t test; *p < 0.05, **p < 0.01. C Representative images of mouse brains showing engraftment of drug combination-treated GSC as detected using a human-specific anti-NES antibody (n = 3). D Survival curves of mice from A. Log-rank test. *p < 0.001. Representative images (E) and frequency (F) of H3K27ac+ GSC (NES+) in DMSO vs. drug combination-treated GSC (n = 3, 4 sections per mouse brain) (mean ± SD). Comparison of E2F1 (G) and H2AZ2 (H) mRNA levels in TCGA and Gravendeel glioma patients based on a STAT3high vs. STAT3low gene signature. I Pathways that are overrepresented in H2AZ2 correlated genes in glioma patients from TCGA and REMBRANDT cohorts using ConsensusPathDB analysis. G, H Mann–Whitney test, (I) hypergeometric test.

