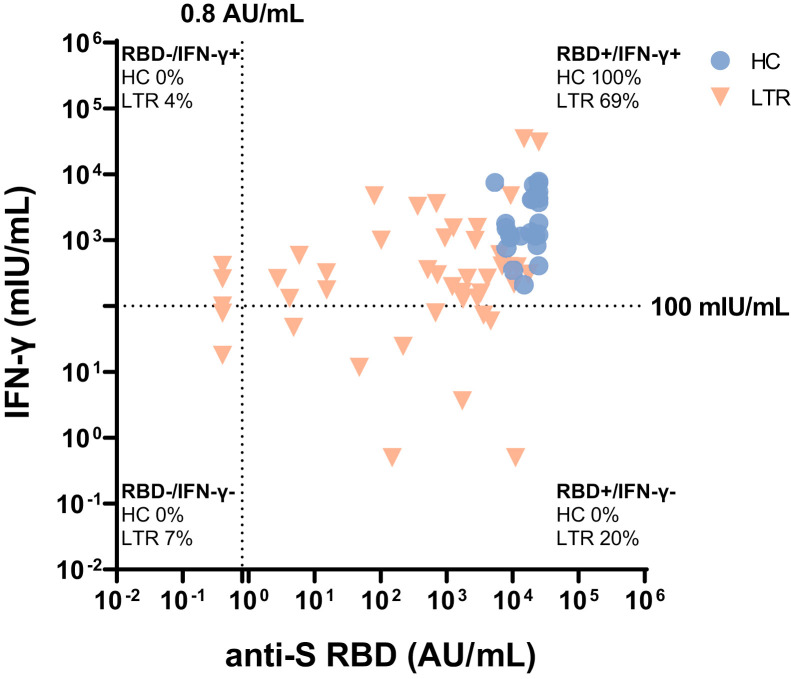
Supplementary Figure 5.
Correlation between humoral and T-cell immune response after third vaccination. Correlation between humoral and T-cell immune response for LTR (red descending triangles) and healthy controls (blue dots) after third vaccination. Humoral response measured with anti-S RBD (AU/mL); T-cell response measured with IFN-γ release (mIU/mL). Dotted lines indicate cutoff values. Percentages indicate proportions of values for every patient group.

