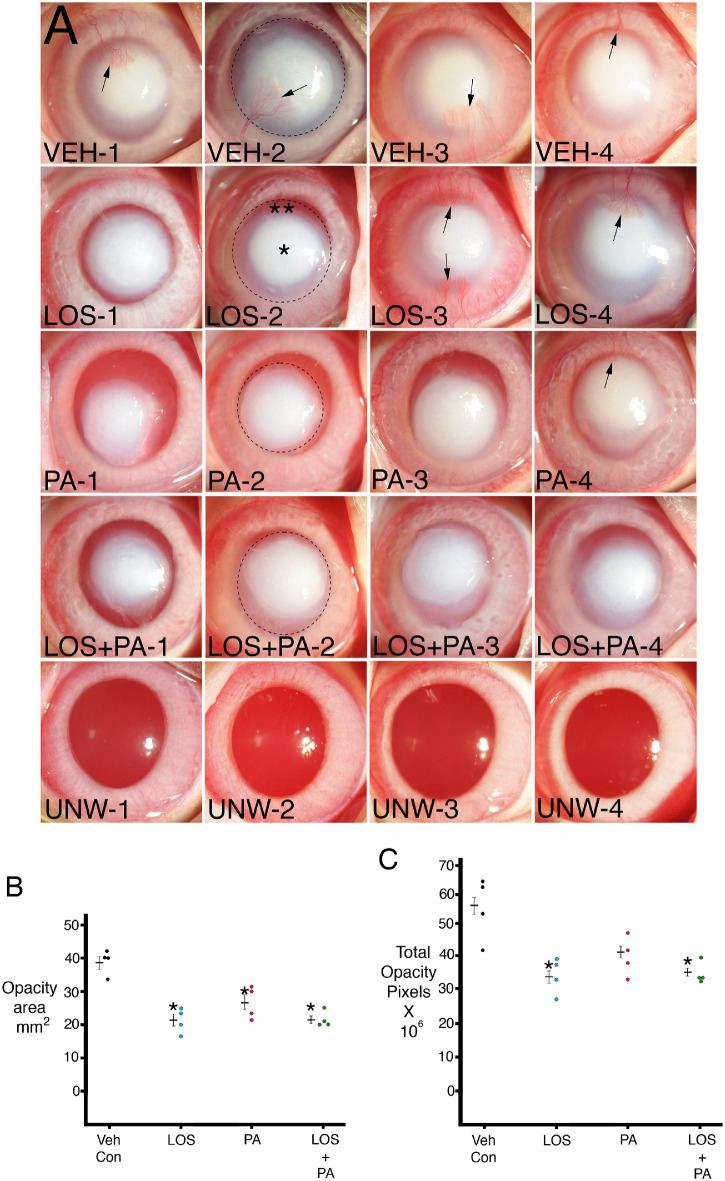
Figure 1.
(A) Standardized slit-lamp photos of rabbit corneas at 1 month after a 1-minute exposure to 1N NaOH on a 5-mm diameter filter paper and continuous treatment for 1 month with topical vehicle (VEH), 0.2 mg/mL losartan, 1% prednisolone acetate, or 0.2 mg/mL losartan + 1% prednisolone acetate six times per day. Note that opacity in each cornea is made up of central more dense (*) and peripheral less dense (**) zones. Arrows indicate central corneal neovascularization. Dotted circles show examples of ImageJ analysis of total opacity for individual corneas that include the combined more dense central and less dense peripheral zones. UNW-1 to UNW-4 are unwounded and untreated controls for comparison. Magnification 15×. (B) Graph of total opacity area measured with ImageJ in individual corneas. Mean ± standard error of the mean is shown for each group. * indicates the opacity was significantly different from the vehicle BSS control group. Table 2 shows Kruskal–Wallis P values for comparisons between the groups. (C) Graph of total opacity in pixels intensity measured with ImageJ in individual corneas. Mean ± standard error of the mean is shown for each group. * indicates the opacity was significantly different from the vehicle BSS control group. Table 3 shows Kruskal–Wallis P values for comparisons between the groups.

