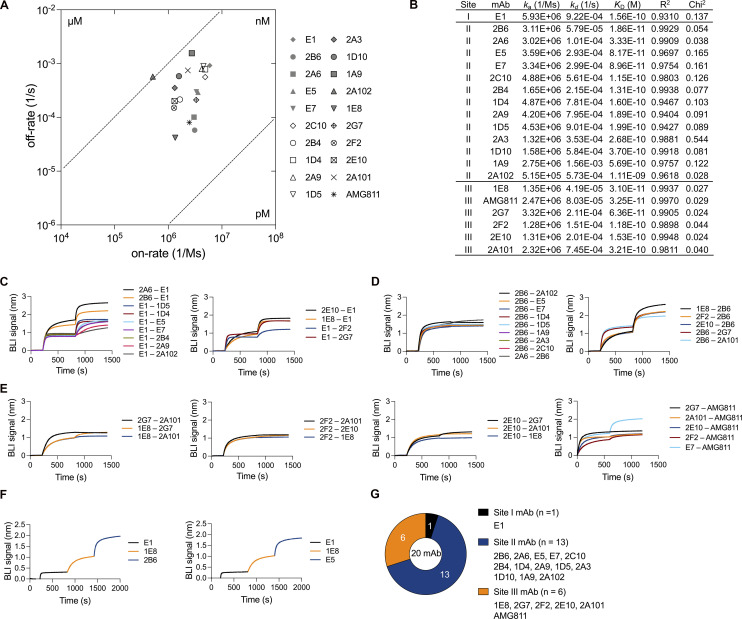
Figure 2.
Binding features of monoclonal AIGAs. (A) Scatter chart of equilibrium KD values, corresponding to the binding affinity, derived from B. KD values were determined from the association (ka) and dissociation (kd) rates of the mAbs (KD = kd/ka). (B) Kinetic values for monoclonal AIGAs and AMG811, which conformed to a 1:1 Langmuir binding model. A χ2 value <3 indicates a good fit of the model to the experimental data. Binding curves are shown in Fig. S2 A. (C–F) Representative graphs showing the in-tandem cross-competition BLI assay for the mAbs and categorizing their binding groups. Biosensor tips were dipped in biotin–IFN-γ (2 μg/ml), then in primary antibody (5 μg/ml), and finally in competing antibody (5 μg/ml). An increase in wavelength (nm) is indicative of binding. The binding readout is depicted in Fig. S2 F. (G) Pie chart showing the three groups of AIGAs (site I, n = 1; II, n = 13; and III, n = 6).

