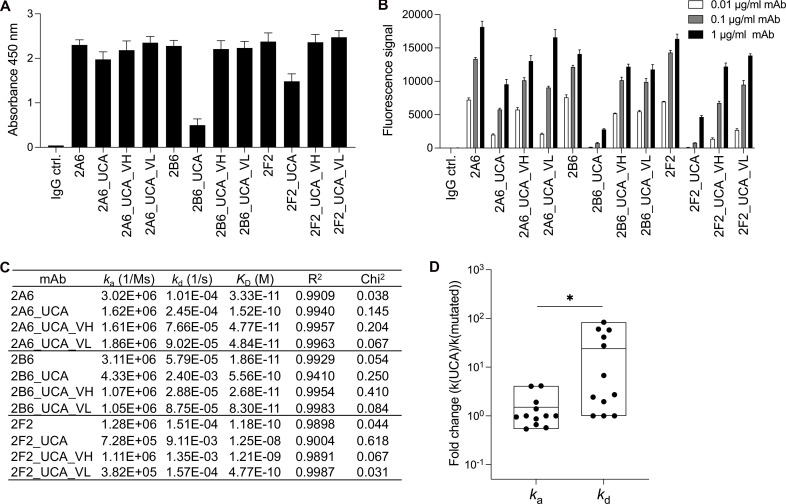
Figure 3.
The contribution of SHM to the ability of antibodies to bind IFN-γ. (A) Bar graph showing ELISA results for reactivity with IFN-γ (2 μg/ml) for three selected highly mutated mAbs (2A6, 2B6, and 2F2; 1 μg/ml), before and after mutation. The control IgG (IgG ctrl.) is a mAb that does not react with IFN-γ. The results are presented as the mean and SD for three independent experiments. (B) The three selected mAbs (2A6, 2B6, and 2F2) were assessed in particle-based assays. The fluorescence signal indicates the ability of the antibody to bind IFN-γ. Two independent runs were performed. The triplicate data are presented as the mean and SD for a single representative experiment. (C) Binding affinity for different UCA variants of AIGAs. The mAbs conformed to a 1:1 Langmuir binding model. A χ2 value <3 indicates a good fit of the model to the experimental data. Binding curves are shown in Fig. S2 A. (D) Fold-changes of ka and kd values between UCA and mutated mAbs (Parental, UCA_VH and UCA_VL) are shown as dots. The results are shown as floating bars from minimum to maximum, with a line indicating the mean. Two-tailed paired Student’s t tests were performed for statistical analysis. *, P < 0.05.

