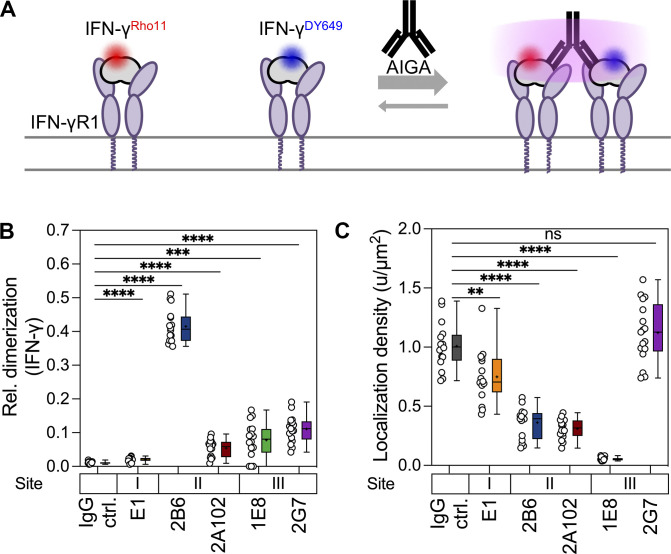
Figure S4.
Dimerization and cell surface receptor binding of IFN-γ in the presence of monoclonal AIGAs. (A) Rho11-labeled IFN-γ (red; 5 nM) and DY649-labeled IFN-γ (blue; 5 nM) were used to assess the binding to the cell surface receptor and potential dimerization induced by monoclonal AIGAs (20 nM). (B) Quantification of ligand homodimerization with Rho11- and DY649-conjugated IFN-γ. Relative tracking of IFN-γRho11 and IFN-γDY649 in the presence of monoclonal AIGAs, as determined by single-molecule cotracking. (C) Quantification of cell surface-bound IFN-γ density in the presence of monoclonal AIGAs by single-molecule localization analysis. The data shown are the mean ± SEM. IgG ctrl (n = 16), E1 (n = 16), 2B6 (n = 16), 2A102 (n = 16), 1E8 (n = 16), 2G7 (n = 17); each data point represents a cell. The binding sites (I, II, and III) on IFN-γ are indicated above the monoclonal AIGAs. The P values in B and C were calculated in unpaired two-tailed Student’s t tests. **, P < 0.01; ***, P < 0.001; ****, P < 0.0001.

