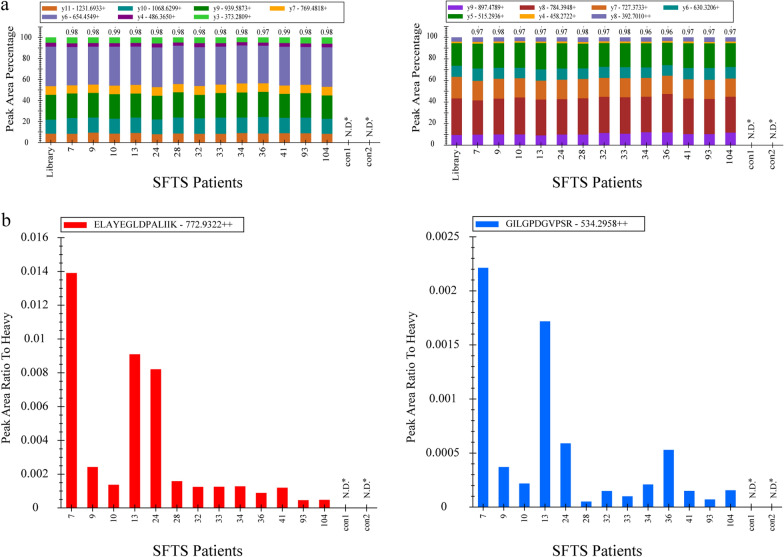
Fig. 2.
Qualitative characteristics of the PRM assay. a All PRM transitions for target peptides were compared with their corresponding spectral library transitions. Each color bar represents one transition ion and its relative intensity among the others. The dot product (dotp) annotated above the bar graph is the normalized dot product of the light transition peak areas with the corresponding intensity in the library. b Relative quantification of target peptides in sera specimens of 13 SFTS patients and two normal subjects. The values were calculated based on each heavy peptide (1 pmol) peak area. The red bar denoted ELAYEGLDPALIIK peptides and blue bar denoted GILGPDGVPSR peptides. N.D.*Not detected

