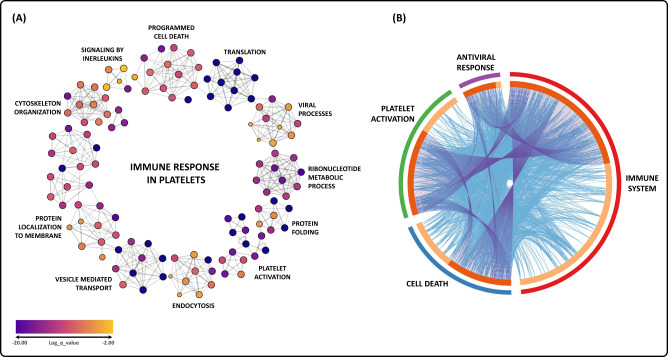
Fig. 2. Interactome analysis and enrichment annotation of all biological processes that involve differentially abundant proteins from both comparisons in the platelet proteome of COVID-19 patients.
A Each node represents an enrichment term statistically ranked by color. B Circus plot shows the overlap in differentially abundant proteins. On the outer side of the plot, the arcs represent the main biological process of each protein list. In the inner part, proteins that appear in multiple biological processes are represented in dark orange, whereas proteins unique to a biological process are depicted in light orange. Blue and purple links inside the plot indicate the degree of functional overlap among the protein lists.

