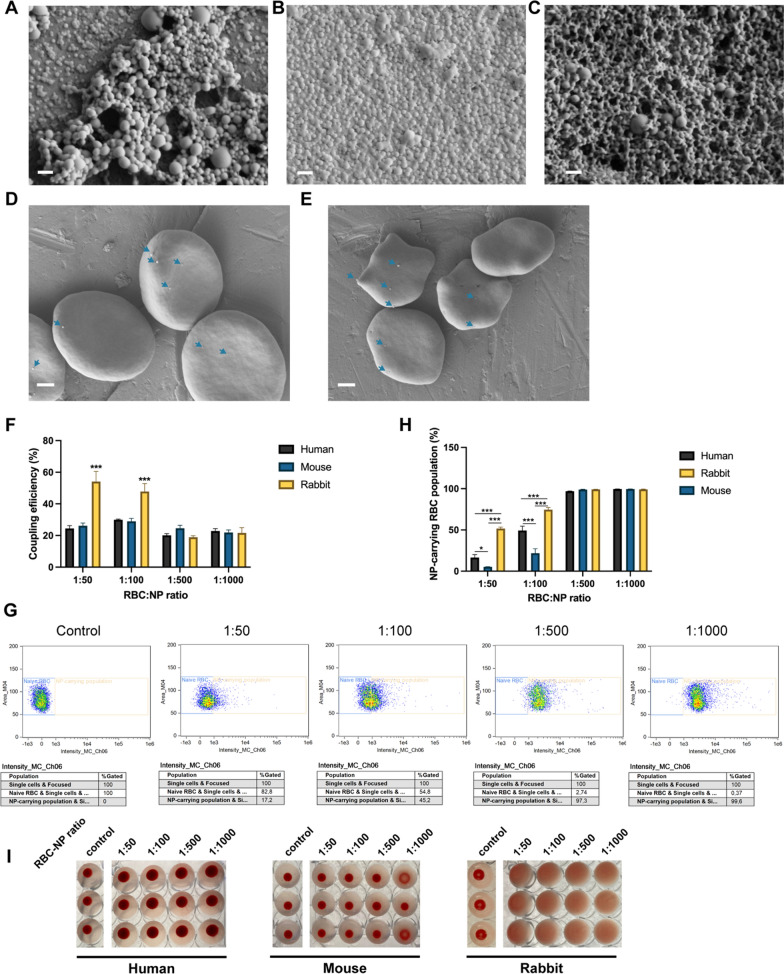
Fig. 2.
Adsorption of PLGA NPs to human, mouse and rabbit RBCs. Scanning electron microscopy image of a plain PLGA NPs, b DEX-PLGA NPs and c PEI-PLGA NPs. Scale bars indicate 400 nm. d Scanning electron microscopy images representing PLGA-NP adsorption onto human RBCs. Scale bars indicate 1 µm. e Scanning electron microscopy images representing PLGA-NP adsorption onto mouse RBCs. Scale bars indicate 1 µm. f Coupling efficiency of PLGA NPs onto human, mouse and rabbit RBCs at different RBC:NP incubation ratios. g Representative scatter plots of flow cytometry analysis, here shown for PLGA65:35 NPs coupled to human RBCs at different ratios. h Percentages of RBC populations carrying NPs. i Agglutination results of human, mouse and rabbit RBCs at different RBC:NP incubation ratios (n = 3). NPs used were PLGA65:35 synthesized with 1.5% PVA. All data are presented as mean ± SEM (n = 3). The number of asterisks indicate the level of significance (two-way ANOVA with Tukey multiple testing), where: *p < 0.05, **p < 0.01 and ***p < 0.001

