
Figure 1.
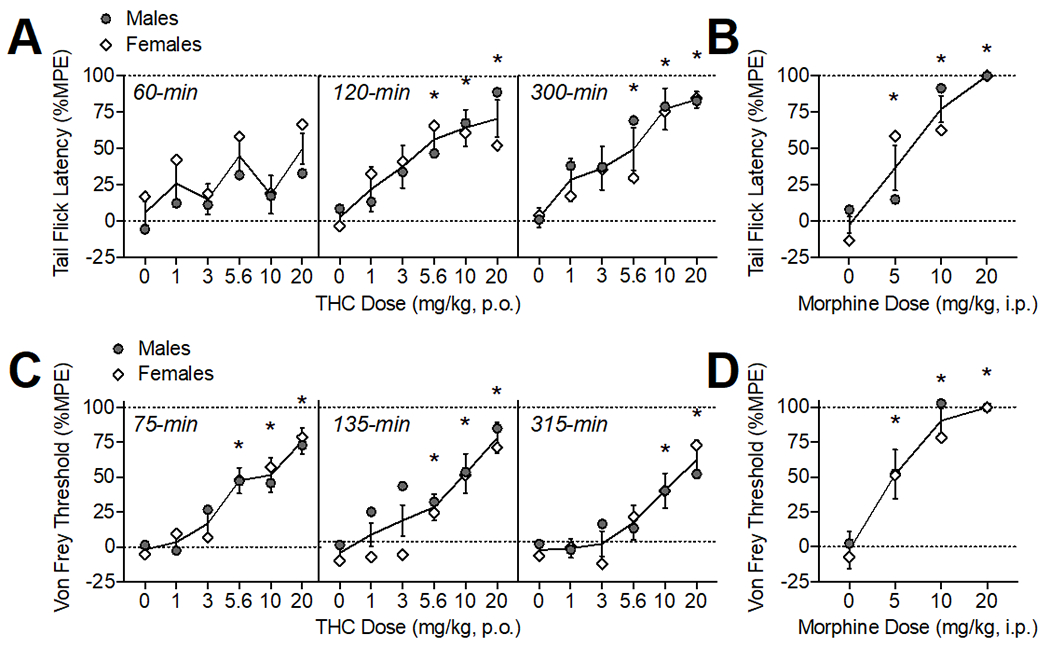
Oral THC effects on thermal (A) and mechanical (C) pain sensitivity. Morphine (i.p.) comparison (B, D). The time of data collection after oral administration is noted in italics. Asterisks (*) represent a significant difference from vehicle. Data are Mean ±SEM; N=6/sex for THC, N=4/sex for morphine.