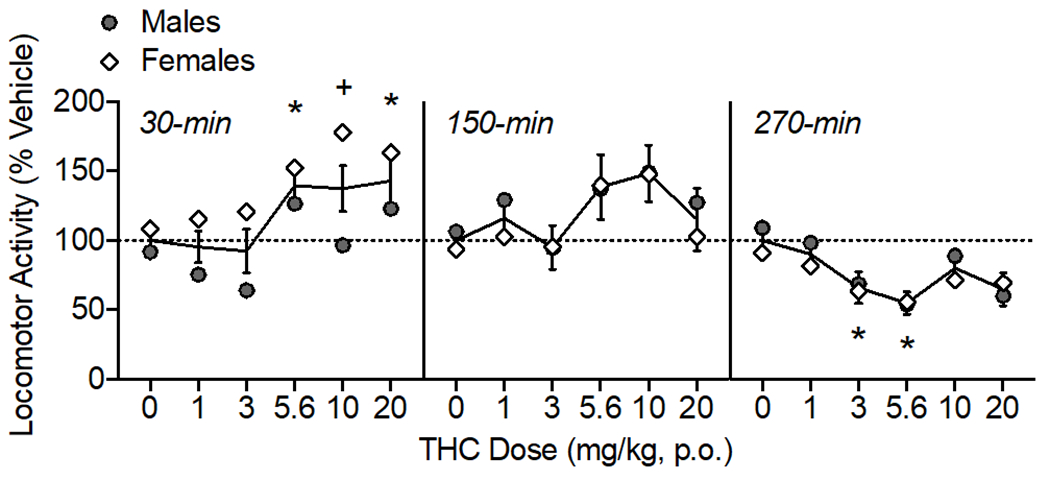
Figure 3.

Oral THC effects on locomotor activity, shown as percent of vehicle distance traveled. The time of data collection after oral administration is noted in italics. Asterisks (*) represent a significant difference from vehicle. Plus sign (+) indicates a sex difference. Data are Mean ±SEM; N=6/sex.
