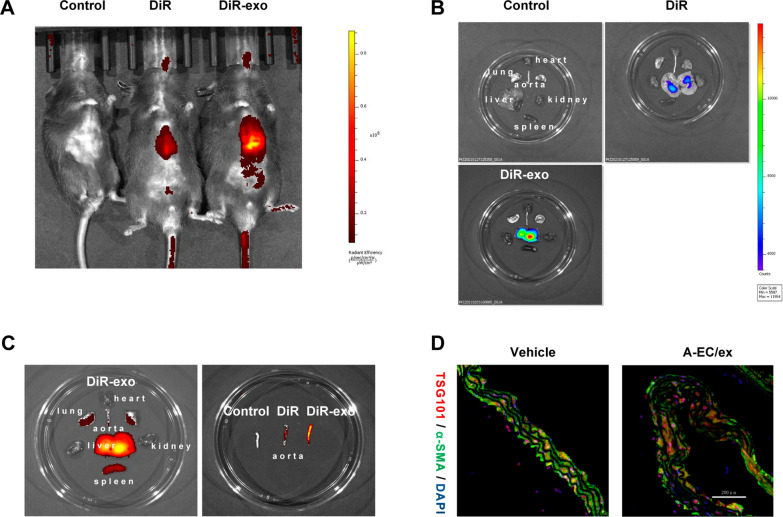
Fig. 5.
Uptake of DiR-labelled sEVs in aortic VSMCs of diabetic vascular calcification (DVC) mice. The DVC mice were subjected to the intravenous administration of control, Dir or Dir-labelled HUVEC-derived sEVs treatments (100 μg/mice, n = 3 per group). A Representative in vivo fluorescence image of sEVs distribution in mice 24 h after sEVs injection. B, C Representative ex vivo fluorescence image of sEVs distribution in organ 24 h after sEVs injection. D Representative fluorescence micrograph showing the sEVs marker TSG101 (red fluorescence) and smooth muscle marker α-SMA (green fluorescence) in thoracic aorta sections. Scale bar represents 200 µm

