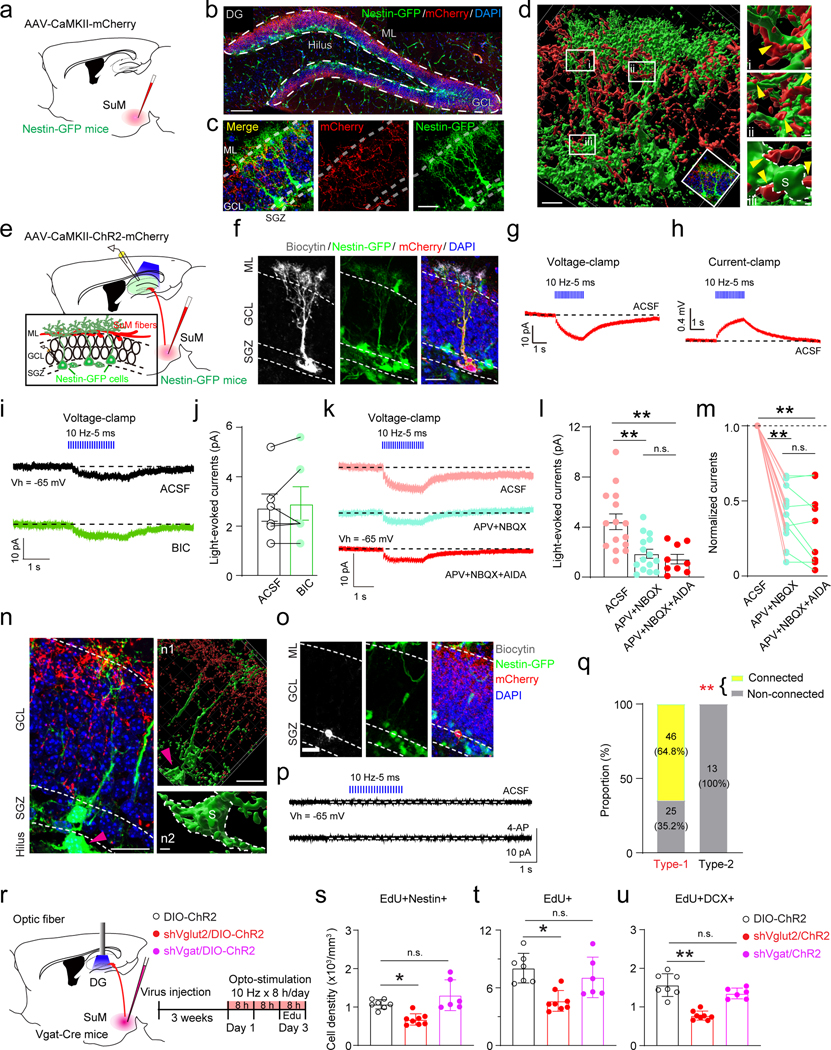
Fig. 1. Activation of SuM-DG projections excites rNSCs through glutamate transmission.
(a) Diagram of anterograde tracing of SuM-DG projections in Nestin-GFP mice.
(b) Representative SuM projections in the granule cell layer (GCL) of the DG. Scale bar = 100 µm. ML: molecular layer.
(c) Bushy heads of Nestin-GFP+ cells were surrounded by SuM-DG projections. Scale bar = 50 µm.
(d) 3D reconstruction of SuM-DG projections. SuM-DG projections were closely associated with bushy heads (i and ii) and soma (iii) of nestin-GFP cells. S indicated soma, yellow arrows indicated associations. Scale bar = 20 µm in d; scale bar = 2 µm in i, ii and iii.
(e) Diagram of ex vivo functional mapping of SuM-DG projections in Nestin-GFP mice.
(f) Biocytin staining of a typical GFP+ rNSC after whole-cell patch-clamp recording. Scale bar = 20 µm.
(g–h) Representative traces showing that blue light pulses induced inward currents (g) under voltage-clamp mode and depolarizations (h) under current-clamp mode in GFP+ rNSC cells (GK-based pipette solution).
(i) Representative traces showing that light-evoked inward currents in the GFP+ rNSC were not affected by bath applied GABAA receptor antagonist bicuculine (BIC).
(j) Quantifications of light-evoked current responses in ACSF or BIC. Data are represented as mean ± SEM. n = 6 cells, two-sided paired t-test, P = 0.5405.
(k) Sample traces of light-evoked inward currents in GFP+ rNSCs before and after application of iGluR NMDA (APV) and AMPA (NBQX), and mGluR I (AIDA) antagonists.
(l) Quantifications of light-evoked currents under pharmacological conditions shown in k. n = 15 cells for ACSF and AMPA+APV group, n = 9 cells for AMPA+APV+NBQX group, one-way ANOVA, F2,36 = 10.18, P = 0.0003.
(m) Summary of the experiments in (k) showing the amplitude of current normalized to ACSF. n = 9 cells.
(n) Representative image showing SuM projections in the SGZ. Few SuM-DG projections were found in the SGZ (n1) and no associations with the intermediate progenitor cell (n2). The pink arrow head indicated the intermediate progenitor cell. Scale bar = 20 µm in N and n1; scale bar = 5 µm in n2.
(o) A biocytin labeled GFP+ progenitor cell in the SGZ after whole-cell patch-clamp recording. Scale bar = 20 µm.
(p) Representative traces from voltage-clamp recordings in a GFP+ progenitor cell following optical activation of SuM-DG projections in ACSF (upper) or 4-AP (lower) bath application.
(q) Proportion of rNSCs and intermediate progenitor cells functionally connected or unconnected to SuM. Fisher’s exact test; P < 0.0001, from 18 mice.
(r) Diagram and stimulation paradigm for in vivo optogenetic activation of SuMVgat-DG projections with shVglut2 or shVgat expression in the SuM.
(s–u) The density of EdU+/Nestin+ (s), EdU+ (t), and EdU+/DCX+ (u) in the DG after optogenetic stimulation. n = 7, 8, 6 mice for ChR2, shVglut2/ChR2 and shVgat/ChR2 groups, respectively. One-way ANOVA, s: F2,18 = 12.38, P = 0.0004; t: F2,18 = 9.338, P = 0.0017; u: F2,18 = 31.67, P < 0.0001 followed by Tukey’s post-hoc test.

