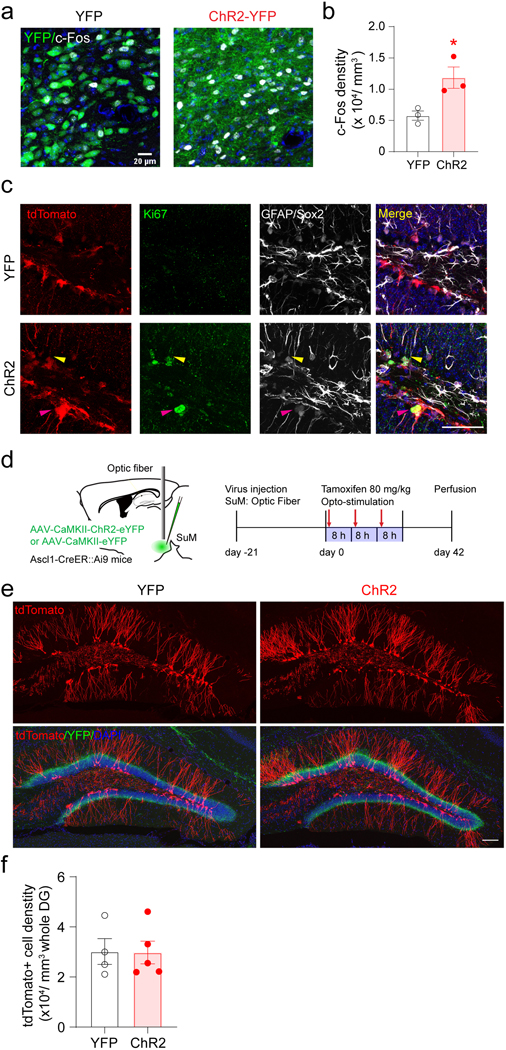
Extended Data Fig. 2. Short-term optogenetic activation of SuM neurons in Ascl1-Ai9 mice.
(a–b) Optogenetic activation increased c-Fos expressions in the SuM. n = 3 mice for each group, P = 0.0309 by two-sided unpaired t-test.
(c) Sample images of tdTomato+, Ki67+ and GFAP+/Sox2+ staining in the DG after optogenetic stimulation of SuM. The yellow arrow head indicated a Ki67+/tdTomato+/GFAP+ cell; the pink arrow head indicated a Ki67+/tdTomato+/Sox2+ cell. Scale bar = 100 µm.
(d) Diagram of optogenetic stimulation of SuM neurons in Ascl1-Ai9 mice. Tamoxifen was i.p. administered at 80 mg/kg following 8 hours optogenetic stimulation of SuM neurons for 3 days. Mice were perfused on day 42 after the first tamoxifen injection.
(e) Sample images of tdTomato+ cells in the DG at day 42 after tamoxifen injection. Scale bar = 100 µm.
(f) The density of tdTomato+ cells in the DG. n = 4 mice for YFP group, n = 5 mice for ChR2 group, P = 0.9558 by two-sided unpaired t-test.

