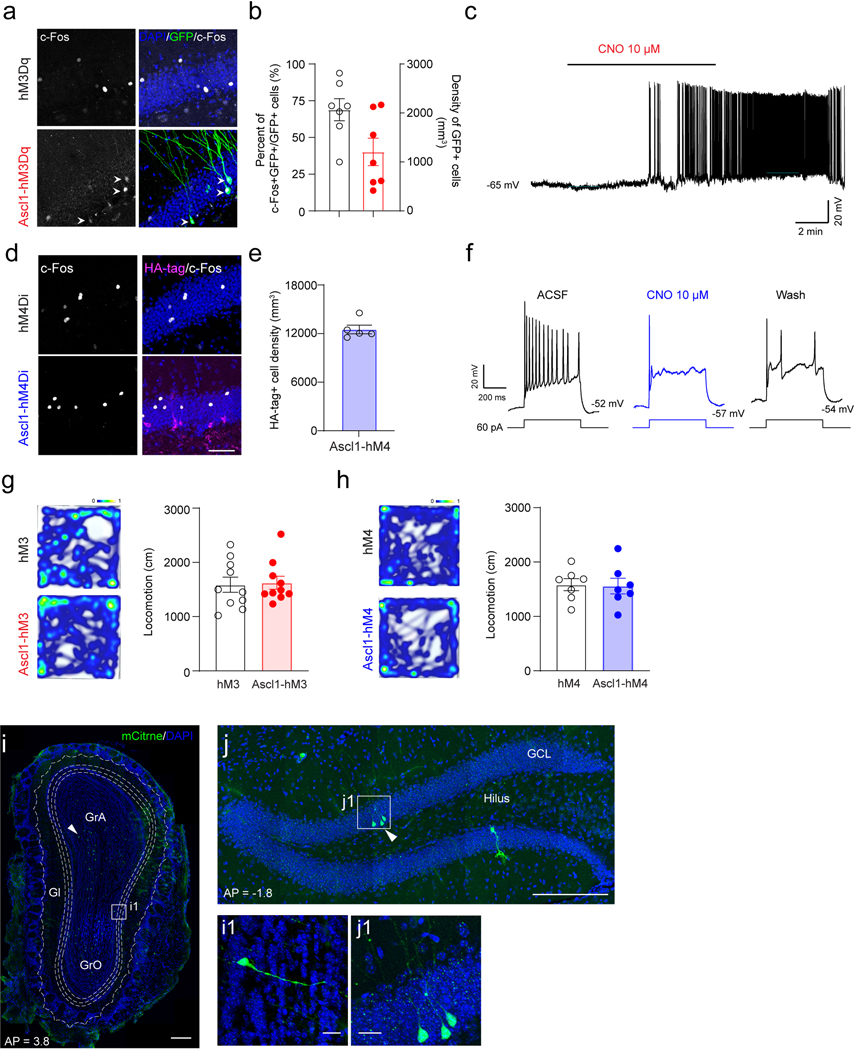
Extended Data Fig. 7. Chemogenetic manipulation of adult-born neurons in Ascl1-hM3Dq and Ascl1-hM4Di mice.

(a) Representative confocal images of mCitrine and c-Fos expression in the DG of Ascl1-hM3Dq or hM3Dq mice. Scale bar = 50 µm.
(b) Percent of c-Fos expression in mCitrine+ cells and density of mCitrine+ cells in the DG of Ascl1-hM3Dq mice after i.p. injection of CNO at 0.5 mg/kg. n = 7 mice.
(c) Sample trace showing that bath application of CNO at 10 µM induced depolarization of membrane potential and increased firing rates in an hM3Dq+ adult-born neuron.
(d) Representative confocal images of HA-tag and c-Fos expression in the DG of Ascl1-hM4Di or hM4Di mice after administration of CNO at 1 mg/kg.
(e) Density of HA-tag+ cells in Ascl1-hM4Di mice. n = 5 mice.
(f) Sample traces showing that action potentials in response to current injections in an hM4Di+ cell before, after and wash out application of 10 µM CNO.
(g) Representative heat map of locomotion tracing for an hM3Dq control and an Ascl1-hM3Dq mouse in the NPR test (left). Quantification of total locomotion in the NPR test (right). n = 10 mice for each group, P = 0.8410 by two-sided unpaired t-test.
(h) Representative heat map of locomotion tracing for an hM4Di control and an Ascl1-hM4Di mouse in the NPR test (left). Quantification of total locomotion in the NPR test (right). n = 7 mice for hM4 group, n = 8 mice for Ascl1-hM4 group, P = 0.9189 by two-sided unpaired t-test.
(i–j) Ascl1 labeled ABNs were found in the OB (i) and DG (j) 32 days after tamoxifen injection. Scale bar = 100 in i and j, scale bar = 10 µm in i1 and j1.
