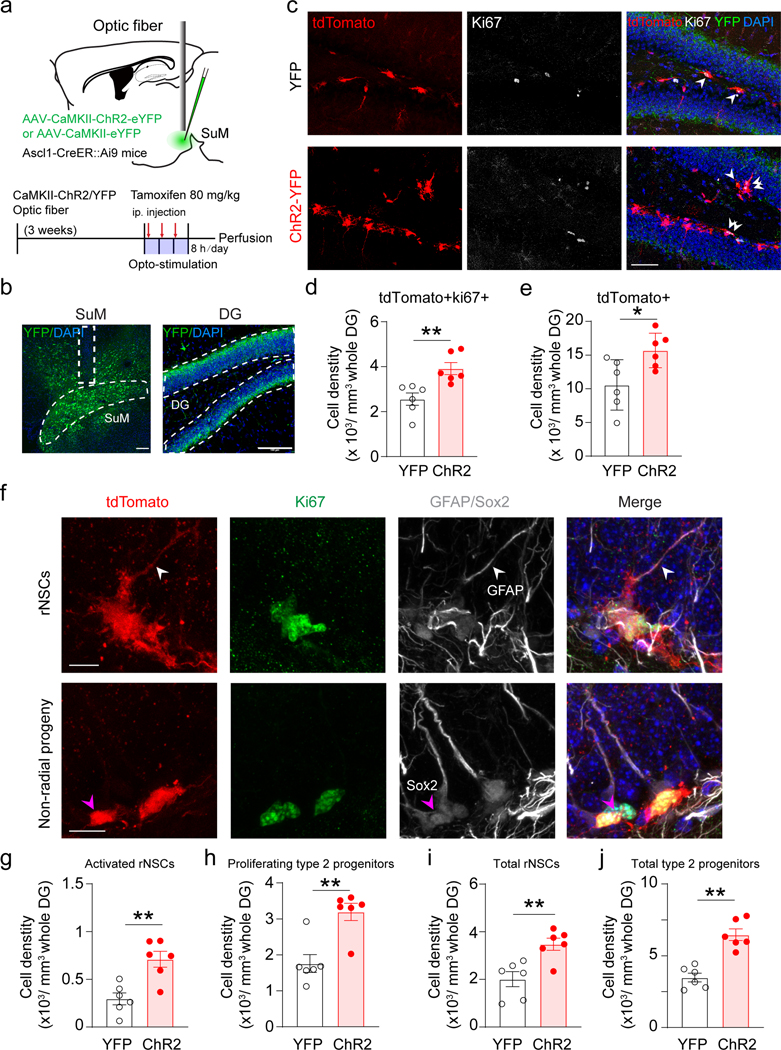
Fig. 2. Stimulation of SuM neurons promotes production of rNSCs and neural progenitors.
(a) Diagram and stimulation paradigm for optogenetic stimulation of SuM neurons in Ascl1-Ai9 mice.
(b) Sample images of ChR2-YFP expression in the SuM neurons and SuM terminals in the DG. Scale bar = 100 µm. Fiber implantation location is indicated by dotted line.
(c) Sample images of tdTomato+ and Ki67+ cells in the DG after optogenetic stimulation of SuM neurons. Scale bar = 50 µm.
(d–e) The density of tdTomato+/Ki67+ (d) and tdTomato+ (e) cells in the DG after optogenetic stimulation of SuM neurons. n = 6 mice for each group, two-sided unpaired t-test, d: P = 0.0053, e: P = 0.02.
(f) Representative identification of proliferative/non-proliferative rNSCs and non-radial progeny. Top: rNSCs were identified as tdTomato+ cells containing GFAP+ radial process (White arrow head). Activated status was determined by presence of Ki67. Bottom: non-radial progeny were counted as tdTomato+Sox2+ cells without a GFAP+ radial process (Pink arrow head). Proliferative status was determined by presence of Ki67. Scale bar = 20 µm.
(g–j) Density of activated rNSCs (g), proliferating type-2 progenitors (h), total rNSCs (i) and total type-2 progenitors (j) in the DG after optogenetic stimulation of SuM neurons. n = 6 mice for each group, two-sided unpaired t-test, g: P = 0.0026, h: P = 0.0002, i: P = 0.0048, j: P = 0.0019, respectively.

