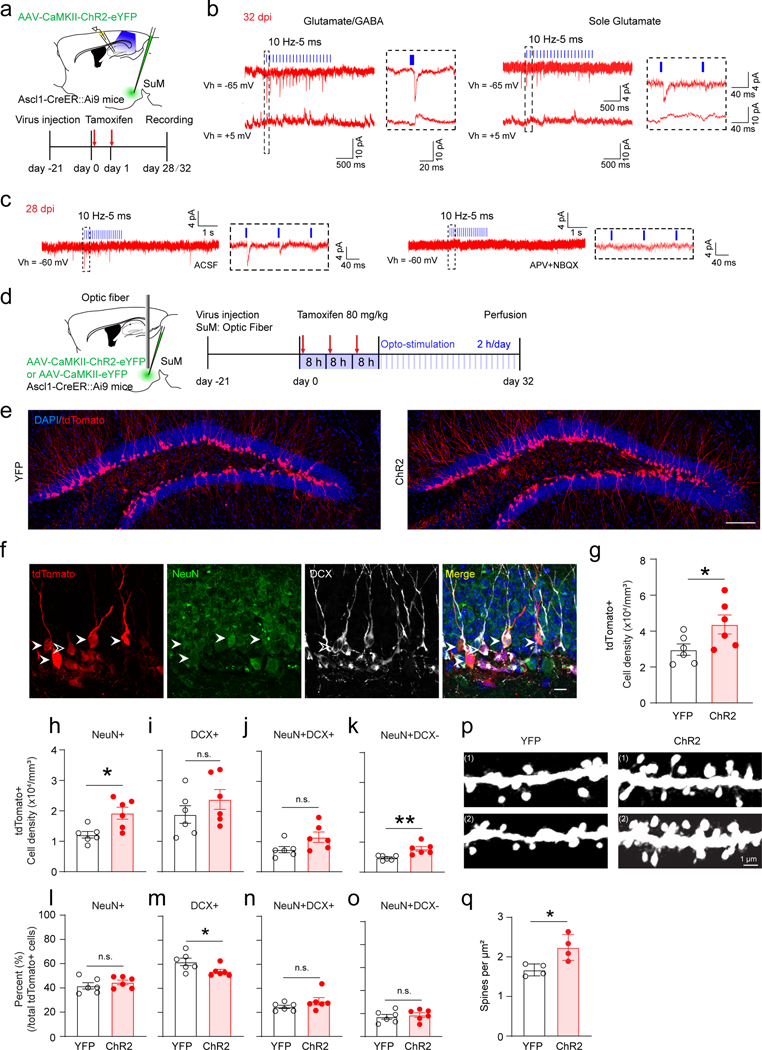
Fig. 4. SuM neurons promote maturation and dendritic spine development of late-stage adult-born immature neurons.
(a) Electrophysiological recording scheme of late-stage immature neurons for optogenetic stimulation of SuM-DG projections in slices from Ascl1-Ai9 mice at 28/32 dpi.
(b) Sample traces showing tdTomato+ cells at 32 dpi received glutamate and GABA inputs (left) or sole glutamate inputs (right) upon optogenetic activation of SuM-DG projections. (Cs-based pipette solutions).
(c) Sample traces showings tdTomato+ cells at 28 dpi received glutamate inputs upon optogenetic activation of SuM-DG projections, which was blocked by AMPAR antagonist APV and NMDAR antagonist NBQX (GK-based pipette solution).
(d) Diagram of in vivo optogenetic stimulation of SuM neurons in Ascl1-Ai9 mice for 32 days.
(e) Representative confocal images of tdTomato+ cells after optogenetic stimulation at 32 dpi. Scale bar = 200 µm.
(f) Representative confocal images of tdTomato+/DCX+/NeuN+ cells in the DG. Solid arrow heads indicate tdTomato+/NeuN+ cells, hollow arrow heads indicate tdTomato+/DCX+/NeuN- cells. Scale bar = 20 µm.
(g) Quantification of density of tdTomato+ cells after 32-day optogenetic stimulation. n = 6 mice for each group, P = 0.0470 by two-sided unpaired t-test.
(h–k) Density of tdTomato+ cells that were also NeuN+ (h), DCX+ (i), NeuN+DCX+ (j), and NeuN+DCX- (k) in the DG after 32-day optogenetic stimulation. n = 6 mice for each group, two-sided unpaired t-test, h: P = 0.0103, i: P = 0.2820, j: P = 0.0660, k: P = 0.0055, respectively.
(l–o) Percent (normalized to total tdTomato+ cells) of tdTomato cells that were NeuN+ (l), DCX+ (m), NeuN+DCX+ (n), and NeuN+DCX- (o) after 32-day optogenetic stimulation of SuM neurons. n = 6 mice for each group, h: P = 0.3831, i: P = 0.0496, j: P = 0.1881, k: P = 0.6194, respectively.
(p–q) Sample dendritic segments (p) and density quantification (q) of dendrite spines on tdTomato+ dendrites after optogenetic stimulation. Scale bar = 1 µm. n = 4 mice for each group, P = 0.0192 by two-sided unpaired t-test.

