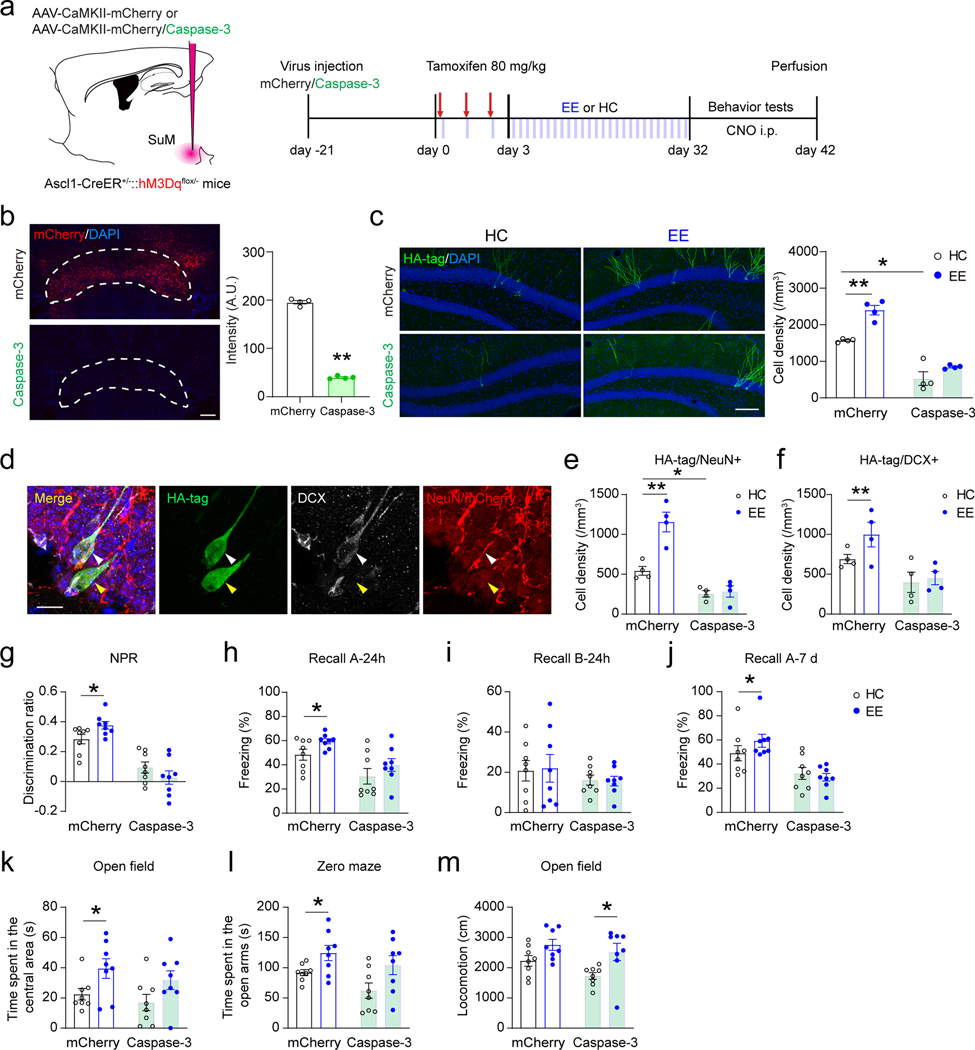
Fig. 8. Ablation of SuM neurons abolishes EE-induced neurogenic effects and behavioral improvement mediated by adult-born neurons.
(a) Experimental design for behavioral testing upon chemogenetic activation of ABNs after ablation of SuM neurons in Ascl1-hM3Dq mice.
(b) Fluorescence of mCherry in the SuM with/without Caspase-3 expression. Scale bar = 100 µm. n = 4 mice for each group, P < 0.0001 by two-sided unpaired t-test.
(c) Sample images and density quantification of HA-tag+ Ascl1-hM3Dq cells in the DG of mCherry-control and SuM-ablated (Caspase-3) mice in HC or EE. Scale bar = 100 µm. n = 4 mice for each group, *P < 0.05; **P < 0.01 by 2-way ANOVA, followed by Tukey’s post-hoc test.
(d) Sample images of HA-tag/DCX/NeuN staining in the DG. Scale bar = 10 µm.
(e–f) Density quantification of HA-tag/NeuN+ (e) and HA-tag/DCX+ (f) cells in Ascl1-hM3Dq mice. n = 4 mice for each group, *P < 0.05; **P < 0.01 by 2-way ANOVA, followed by Tukey’s post-hoc test.
(g) Discrimination of NPR tests after chemogenetic activation of ABNs in Ascl1-hM3Dq HC/EE mice upon SuM mCherry/Caspase-3 expression. n = 8 mice in each group, *P < 0.05; **P < 0.01 by 2-way ANOVA, followed by Tukey’s post-hoc test.
(h–j) Freezing time in context-A (h), context-B (i) at 24 h, and in context-A at 7 day (j) after chemogenetic activation of ABNs in Ascl1-hM3Dq HC/EE mice upon SuM mCherry/Caspase-3 expression. n = 8 mice in each group, *P < 0.05; **P < 0.01 by 2-way ANOVA, followed by Tukey’s post-hoc test.
(k–m) Quantifications of time spent in the center area in open-field test (k), time spent in the open arms in zero maze test (l), and total locomotion (m) in open-field test after chemogenetic activation of ABNs in Ascl1-hM3Dq HC/EE mice upon SuM mCherry/Caspase-3 expression. n = 8 mice in each group, *P < 0.05; **P < 0.01 by 2-way ANOVA, followed by Tukey’s post-hoc test.

