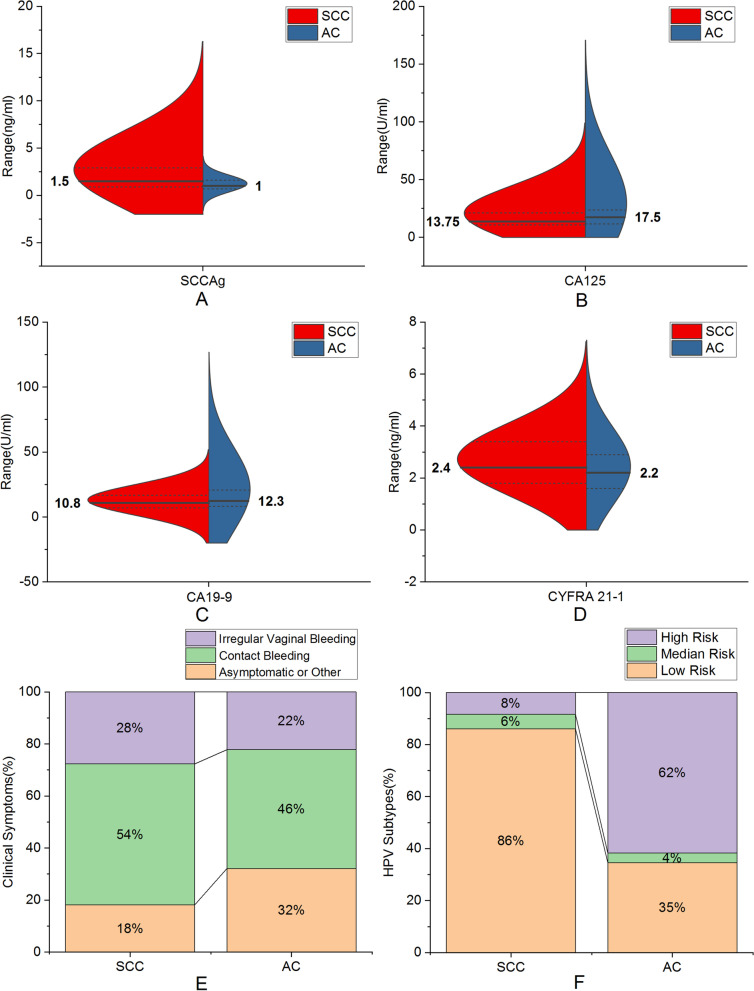
Fig. 1.
Split violin plot of the differences between cervical squamous cell carcinoma and adenocarcinoma in A SCCAg (Mann–Whitney U test; P < 0.001), B CA125 (Mann–Whitney U test; P = 0.031), C CA199 (Mann–Whitney U test; P = 0.030), D CYFRA 21–1 (Mann–Whitney U test; P = 0.023). The solid line represents the median, the dashed line represents the interquartile range, and the violin shape is the probability density estimated based on nuclear density in the split violin plot; Stacked histogram of the differences between cervical squamous cell carcinoma and adenocarcinoma in E clinical symptoms (chi-square test; P = 0.030), F HPV subtypes (chi-square test; P < 0.001)

