
. 2022 Jul 1;6(7):e36315. doi: 10.2196/36315
©Shahen Yashpal, Ananditha Raghunath, Nihan Gencerliler, Lorel E Burns. Originally published in JMIR Formative Research (https://formative.jmir.org), 01.07.2022.
This is an open-access article distributed under the terms of the Creative Commons Attribution License (https://creativecommons.org/licenses/by/4.0/), which permits unrestricted use, distribution, and reproduction in any medium, provided the original work, first published in JMIR Formative Research, is properly cited. The complete bibliographic information, a link to the original publication on https://formative.jmir.org, as well as this copyright and license information must be included.
Figure 3.
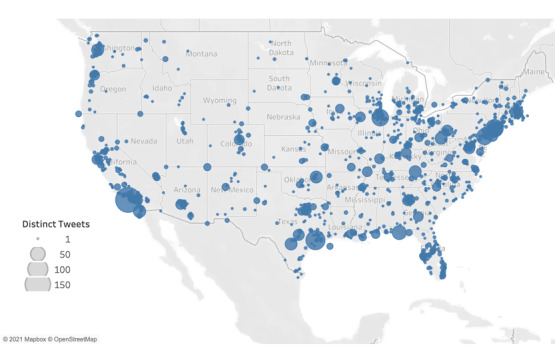
Map of tweet geolocations. Size of the dot represents the volume of tweets at a given latitude-longitude pair.