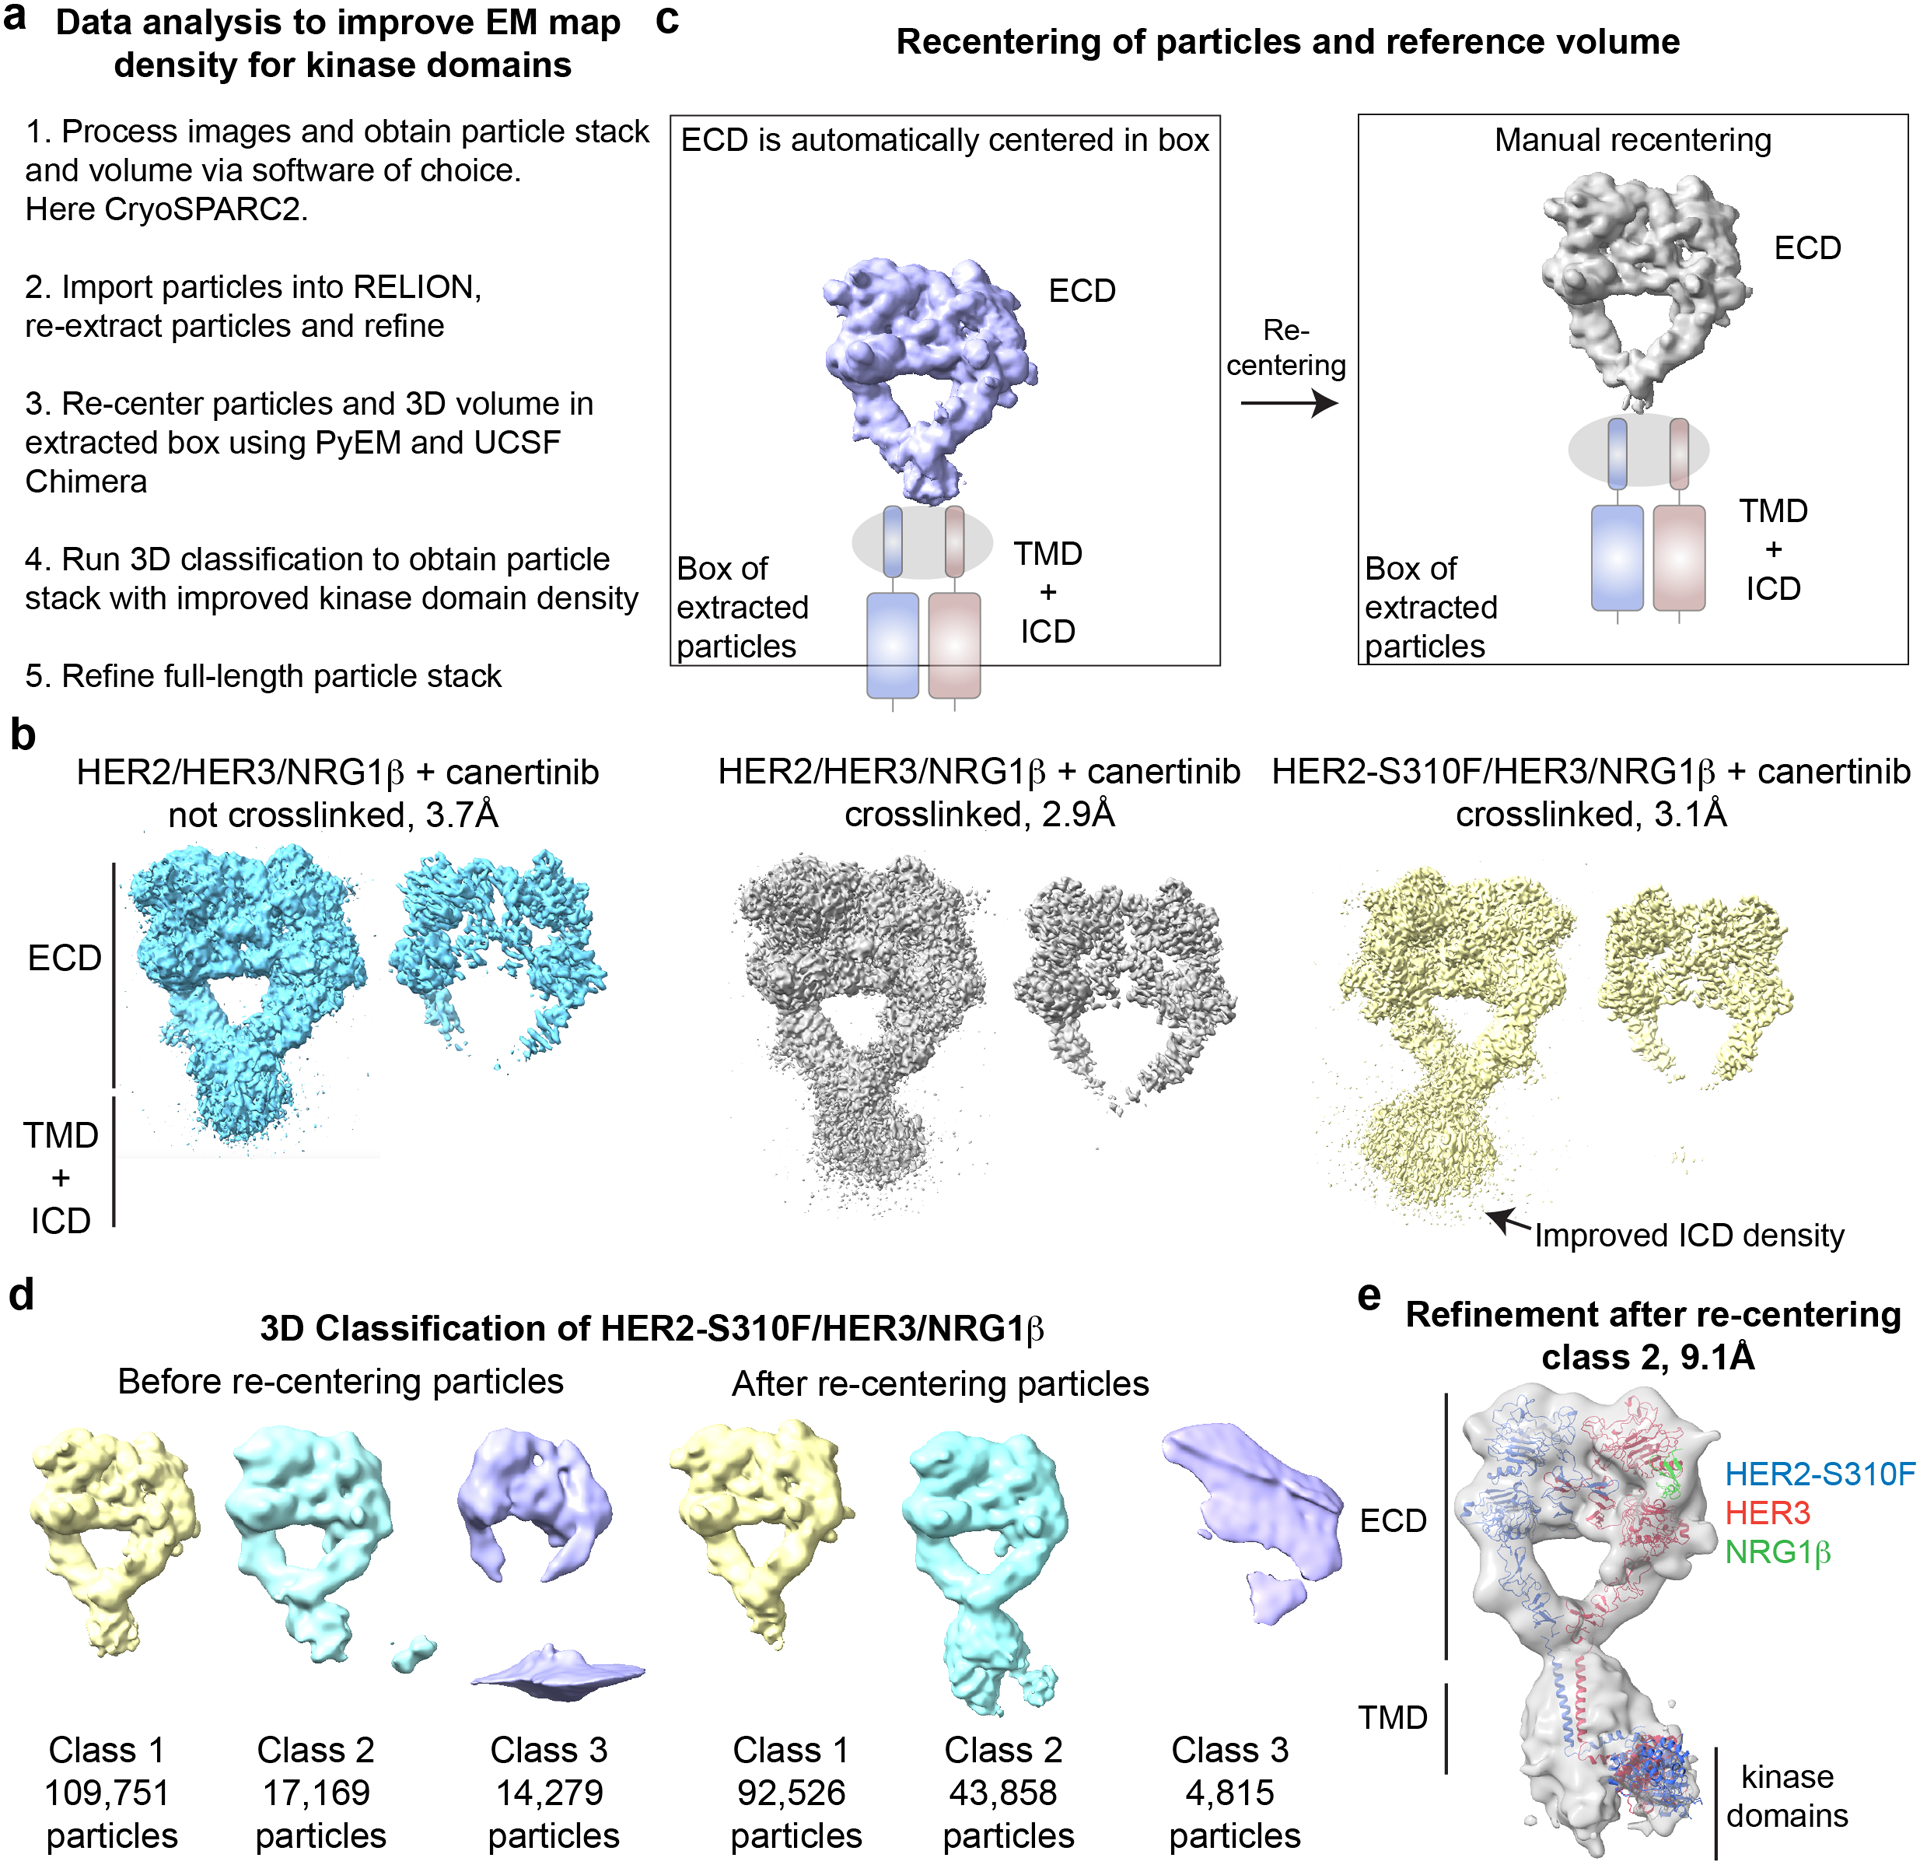
Figure 4: Processing scheme for obtaining improved maps of full-length complexes.

a, Overview of the data and the processing pipeline for the HER2/HER3/NRG1β and HER2-S310F/HER3/NRG1β complexes. b, Low- and high-contour EM maps of the complexes show best transmembrane and intracellular domain density for the crosslinked HER2-S310F/HER3/NRG1β complex. c, Illustration of the re-centering process using UCSF chimera and PyEM. d, 3D classification in RELION3 of the HER2-S310F/HER3/NRG1β complex before and after re-centering coordinates. e, 9.1 Å resolution full-length reconstruction of the HER2-S310F/HER3/NRG1β complex. Models used for fitting into cryo-EM map included: PDB ID: 7MN6 for the HER2-S310F/HER3/NRG1β extracellular domain dimer (Diwanji et al., 2021); PDB ID: 2N2A for the transmembrane domains and juxtamembrane-A (JM-A) segments (Bragin et al., 2016); and the model of the asymmetric HER2/HER3 kinase dimer generated based on PDB ID: 3PP0 (Aertgeerts et al., 2011) and PDB ID: 4RIW (Littlefield et al., 2014).
