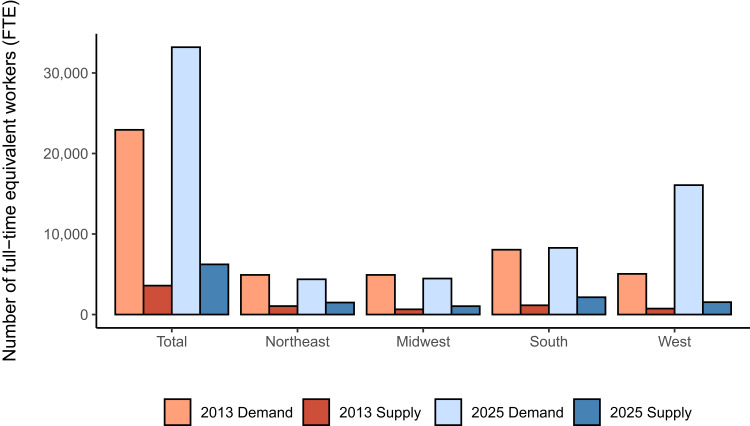
Figure 2.
Current and projected geriatrician workforce supply and demand for services: data from the US Health Resources and Services Administration (HRSA).
Notes: The authors created this figure with data from HRSA’s National Center for Health Workforce Analysis, 2017 (data from US Department of Health and Human Services, Health Resources and Services Administration, National Center for Health Workforce Analysis).133 Projections assume that 30% of the population aged 65+ will need care by a geriatrician (whether in- or out-patient care; data from Fried LP and Hall WJ)134 and current rates of healthcare workforce participation and patterns of health care utilization. HRSA estimated regional demands based on regional population characteristics (eg, age, sex, household income, insurance status, health status, etc.).

