
Extended data figure 10. Human lung macrophage infection was enhanced by antibodies and reduced by CD16, ACE2, or RdRp blockade in vivo and in vitro (matched to figure 2).
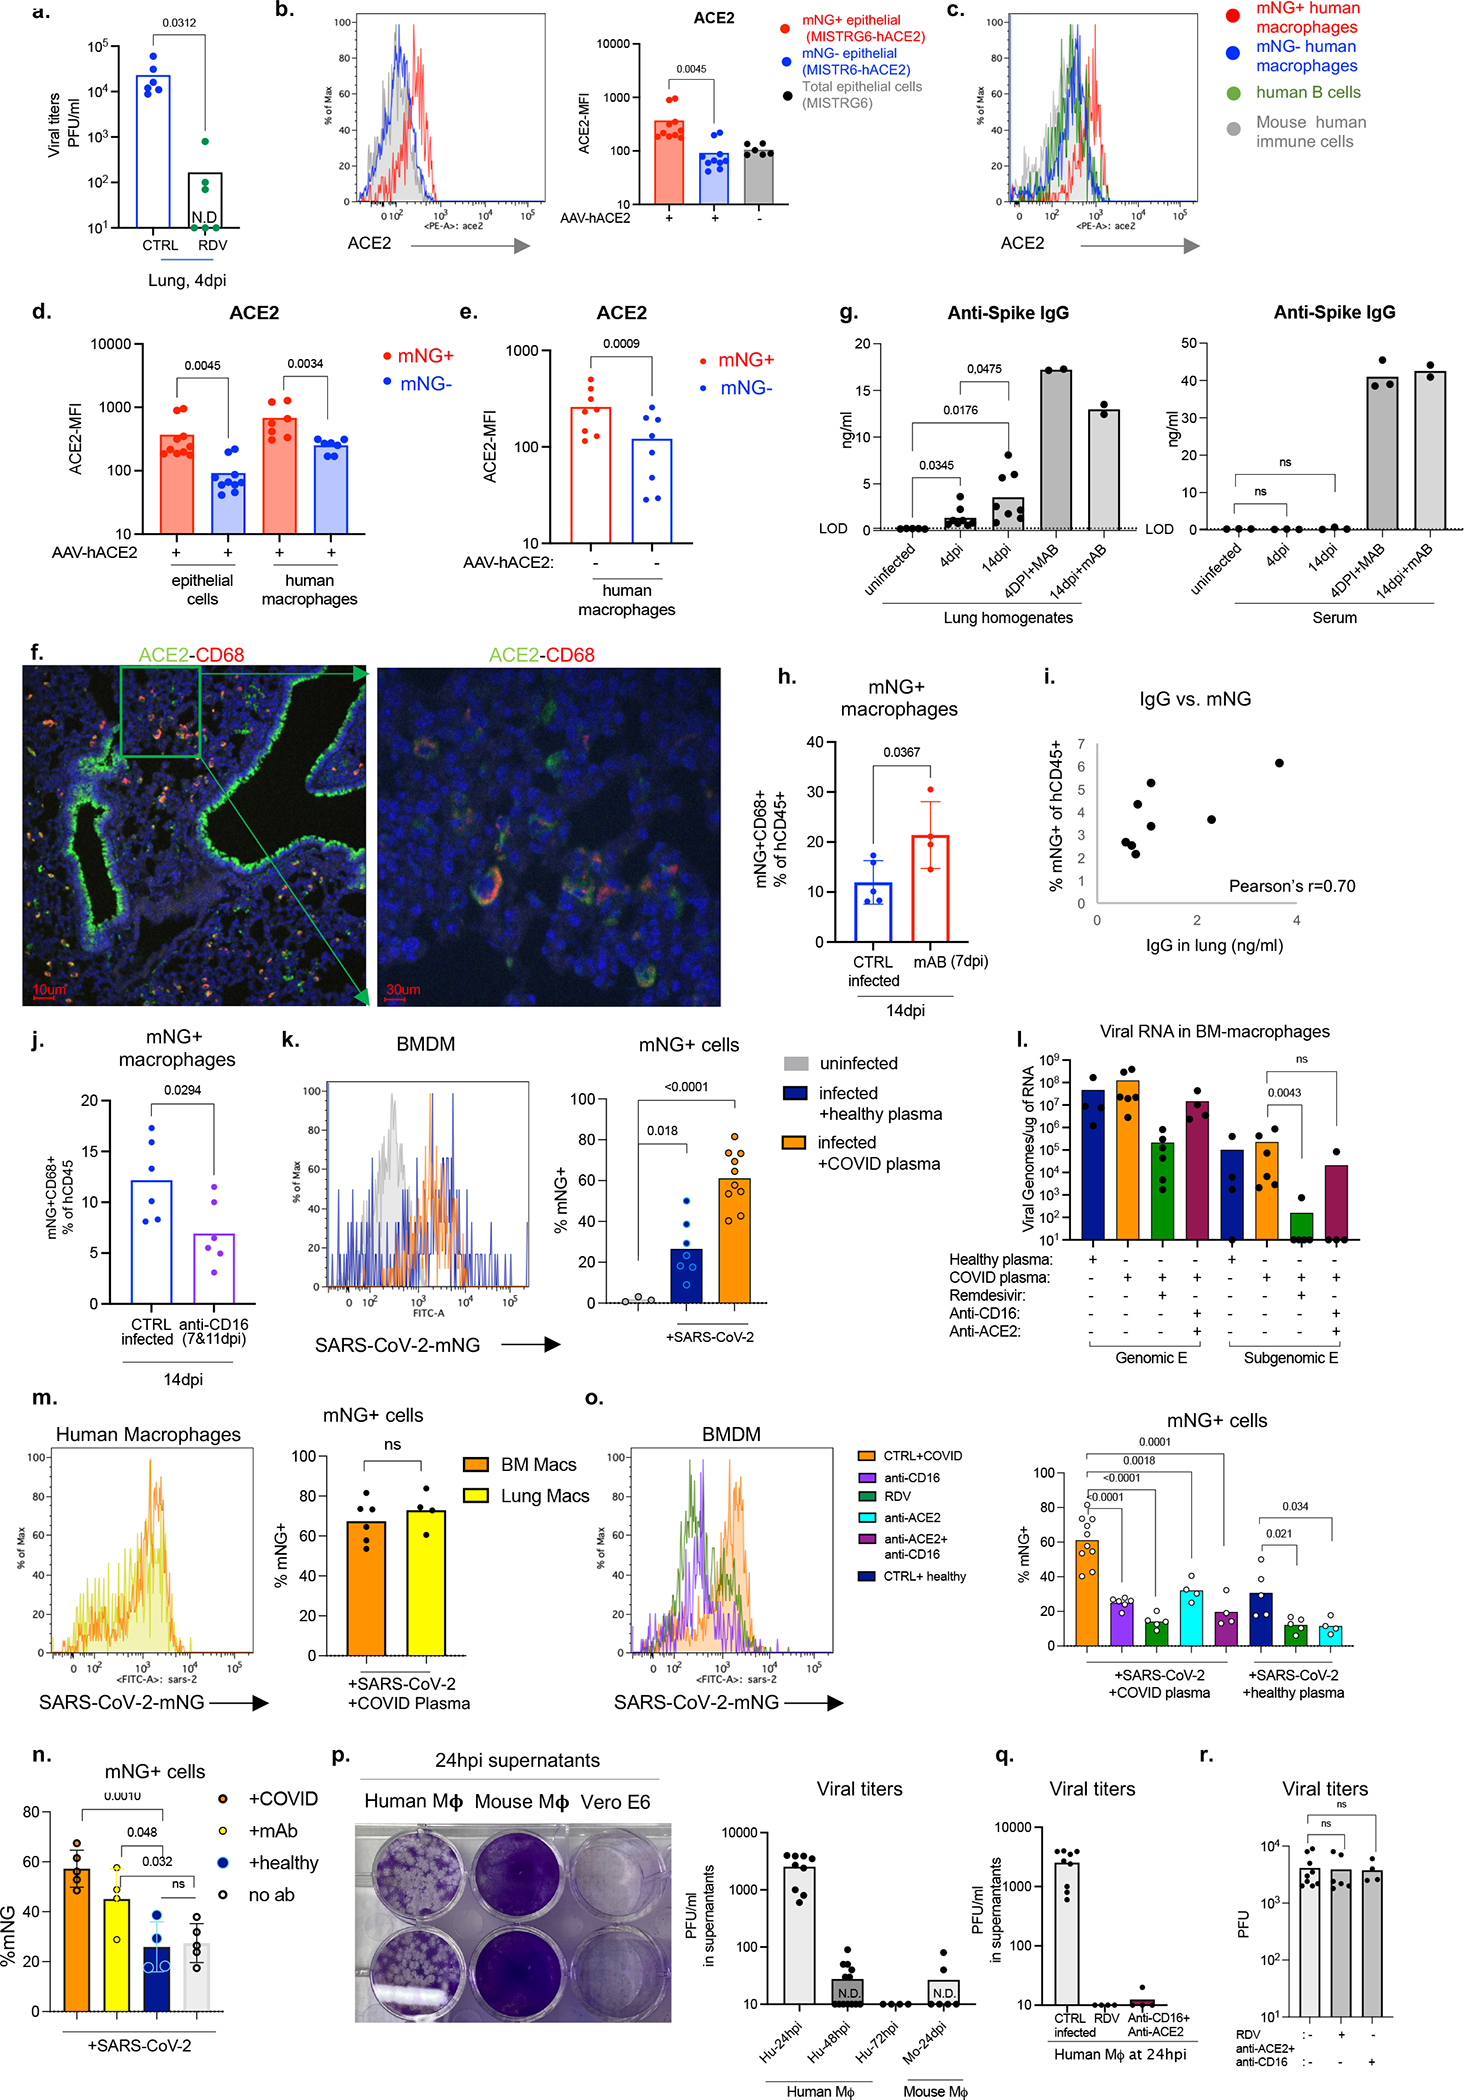
a. Viral titers in lung homogenates of Remdesivir (RDV) treated or control untreated MISTRG6-hACE2 mice infected with SARS-CoV-2-mNG. CTRL infected n=6, RDV treated n=6 biologically independent mice examined over 3 independent experiments.
b. Representative histograms and mean florescent intensity (MFI) for ACE2 expression in mNG+ or mNG− epithelial cells from MISTRG6-hACE2 mice or total epithelial cells from MISTRG6 (AAV−) mice infected with SARS-CoV-2-mNG. AAV+ N=10, AAV− N=6 biologically independent mice examined over at least 3 independent experiments. Paired, two-tailed t-test.
c. Representative histograms for ACE2 expression in mNG+ or mNG− human macrophages, human B cells (CD19+) or mouse immune cells isolated from MISTRG6-hACE2 mice infected with SARS-CoV-2-mNG. Representative of N=10 for epithelial cells, N=7 for human macrophages biologically independent mice examined over at least 3 independent experiments.
d. MFI of ACE2 expression in mNG+ or mNG− human macrophages or mouse epithelial cells isolated from SARS-CoV-2-mNG infected MISTRG6-hACE2 mice. Epithelial cells n=10, human macrophages n=7 biologically independent mice examined over at least 3 independent experiments. Paired, two-tailed t-test.
e. MFI of ACE2 expression in mNG+ or mNG− human macrophages isolated from MISTRG6 (AAV-) mice infected with SARS-CoV-2-mNG. Epithelial cells are virtually not infected with SARS-CoV-2-mNG in MISTRG6 mice without transduced hACE2. N=8 biologically independent mice examined over at least 3 independent experiments. Paired, two-tailed t-test.
f. Representative fluorescent microscopy images showing colocalization of human ACE2 and human CD68 cells in SARS-CoV-2 infected MISTRG6-hACE2 mice. Representative of 3 independent mice over 2 independent experiments.
g. Anti-Spike (RBD) IgG levels measured by ELISA in serum or lung homogenates of SARS-CoV-2 infected (4 and 14dpi) or uninfected MISTRG6-hACE2 mice treated therapeutically with mAbs (treated at 35hpi or 7dpi) or not. Lung homogenates: Uninfected n=5, 4dpi n=8, 14dpi n=8, 4dpi+mAB n=2, 14dpi+mAB n=2 biologically independent mice representative of at least 2 experiments. Serum: Uninfected n=3, 4dpi n=3, 14dpi n=3, 4dpi+mAB n=3, 14dpi+mAB n=2 biologically independent mice representative of at least 2 experiments. Unpaired, two-tailed t-test.
h. Frequencies of mNG signal in human immune cells in infected mice (14dpi) treated therapeutically with monoclonal antibodies45,64 (mAb) at 7dpi. CTRL infected n=5, mAb treated n=4 biologically independent mice examined over 2 independent experiments. Means with datapoints and SD. Paired, two-tailed t-test.
i. Two-way plot showing anti-Spike (RBD) IgG levels and corresponding mNG+ human immune cell proportions in lungs of infected MISTRG6-hACE2 mice at 4dpi. Pearson’s correlation value =0.70. N=8 biologically independent mice examined over 4 independent experiments.
j. Frequencies of mNG+ human macrophages in human immune cells in SARS-CoV-2-mNG infected MISTRG6-hACE2 mice treated with anti-CD16 antibody (Abcam-clone SP175) at 7dpi and 11 dpi and analyzed at 14dpi. n=6 biologically independent mice examined over 3 independent experiments. Unpaired, two-tailed t-test.
k. Representative histograms and frequencies of mNG+ cells in BMDMs cultured (or not) with SARS-CoV-2-mNG for 48 hours. Cells were treated with pooled plasma from healthy controls (prior to COVID-19 pandemic) or convalescent COVID-1945 patients. Uninfected n=3, infected+ healthy plasma n=7, infected+ COVID plasma n=10 independent samples cultured and analyzed over at least 3 experiments. Means with datapoints. Unpaired t-test. P<0.0001=1.57×10⁻⁵.
l. Quantification of genomic (gRNA) and subgenomic (sgRNA) viral RNA (E gene) in infected BMDMs at 48hpi. Cells were treated with plasma from healthy controls or convalescent COVID-19 patients. Healthy plasma: n=4, COVID plasma n=6, RDV: n=6, anti-CD16+anti-ACE2 n=4 independent samples analyzed over at least 2 independent experiments. Means with datapoints. Mann-Whitney, two-tailed, t-test.
m. Representative histograms and frequencies of mNG+ cells in BMDMs and lung macrophages cultured with SARS-CoV-2 in presence of plasma of convalescent COVID-19 patients. mNG+ macrophages were pre-gated on live (live-dead stain negative) cells at 48hpi. BMDMs N=6, Lung macrophages N=4 independent samples analyzed over 2 independent experiments. Unpaired, two-tailed t-test.
n. Frequencies of mNG+ cells in BMDMs cultured with SARS-CoV-2 or not in presence of healthy patient plasma, COVID plasma, monoclonal antibodies (clones 135 and 144) or no antibodies. COVID plasma n=5, mAb n=4, healthy plasma n=4, no Ab n=5 independent samples analyzed over 2 independent experiments. Means with datapoints and SD. The same monoclonal antibody cocktail used was used in vivo (Fig. 3). Unpaired, two-tailed t-test.
o. Representative histograms and frequencies of mNG+ cells in BMDMs cultured with SARS-CoV-2-mNG (or not) in presence or absence of COVID plasma. Cultures were treated with Remdesivir, anti-human CD16 antibody and/or anti-human ACE2 antibody. Healthy plasma n=5, COVID plasma n=10, RDV n=5, anti-CD16 n=6, anti-ACE2 n=4, anti-CD16+ACE2 n=4 independent samples analyzed over at least 2 independent experiments. Means with datapoints. Unpaired two-tailed t-test. P values<0.0001: anti-CD16 vs COVID plasma= 1.98×10⁻⁵, RDV vs. COVID plasma= 5.24×10⁻⁶.
p. Viral titers and representative plaque images from supernatants of human or mouse BMDMs infected with SARS-CoV-2 mNG in vitro (without COVID plasma). Infectious virus from supernatants of infected macrophage cultures collected at 24hpi, 48hpi and 72 hpi was plaqued using Vero ACE2+TMPRSS2+ cells. Supernatant collected from Vero E6 cell cultures were provided as reference. Human: 24hpi n=9, 48 hpi n=13, 72hpi n=4. Mouse: 24hpi n=6 independent samples analyzed over at least 2 independent experiments.
q. Viral titers from supernatants of BMDMs infected with SARS-CoV-2 mNG in vitro and treated with Remdesivir (RDV) or a combination of anti-CD16 and anti-ACE2 antibodies. Cultures were not supplemented with COVID plasma. Infectious virus from supernatants of infected macrophage cultures collected at 24hpi was plaqued using Vero ACE2+TMPRSS2+ cells. CTRL n=9, RDV n=4, anti-CD16 and anti-ACE2 n=4 independent samples representative of 2 independent experiments. Means with datapoints.
r. Viral titers measured as PFUs using supernatants containing concentrations of Remdesivir (1μm) or anti-ACE2 (1μg/ml) and anti-CD16 antibodies diluted to (1:10) allow quantification of PFUs at 24hpi from macrophage cultures. Supernatants were applied on Vero ACE2+ TMPRSS2+ cells which were then infected with a matched inoculum of SARS-CoV-2 mNG (103 PFU quantified in Vero-E6 cells) to test carry over effect in plaque quantification. Untreated N=9, RDV N=6, anti-ACE2+anti-CD16 n=4 independent datapoints collected over 3 independent experiments. Means with datapoints. Unpaired, two-tailed, t-test.